
Introduction: Indian Stock Market Outlook for 2–6 November 2026
The Indian stock market enters the first trading week of November 2026 with a potentially volatile start, followed by opportunities for recovery and positive momentum, according to the supplied financial astrology analysis.
The weekly forecast for 2–6 November 2026 highlights possible initial strength followed by weakness on Monday, two-sided market movement with bearish periods on Tuesday, a sudden mid-session spike on Wednesday, mild bullishness on Thursday, and a potentially positive session on Friday.
The astrological analysis focuses on the Moon’s movement through Ashlesha, Magha and Hasta Nakshatras, its relationship with Mars, Rahu, Jupiter and Ketu, and aspects involving Jupiter and Venus.
The broader November outlook also highlights several planetary developments:
- Jupiter’s transit into Leo on 30 October.
- Venus moving back into Virgo in retrograde motion on 6 November.
- A possible market reversal associated with the Moon–Mercury combination on 8 November.
- Mars transiting into Leo on 13 November.
- Venus returning to Libra on 23 November.
The supplied historical analysis suggests three broad market phases during November: a potentially bullish tendency up to 7 November, a bearish tendency from 7–19 November, and another potentially bullish phase from 20–30 November. But this time, probably after 20th november Market can be in a downtrend.
Along with these observations, this article covers the important NIFTY 50 and BANKNIFTY levels for the week.
Weekly closing reference levels:
- NIFTY 50: 23,087
- BANKNIFTY: 54,687
Let’s examine the daily outlook, important intraday timings, and technical reference levels.
NIFTY 50 Weekly Prediction: 2–6 November 2026
The supplied financial astrology analysis indicates a volatile beginning to the week, with possible weakness developing after initial strength. Tuesday may bring movement in both directions, while Wednesday could experience a sudden mid-session spike.
Thursday’s forecast suggests mild bullishness, and Friday is identified as a day with a higher possibility of positive market behaviour.
NIFTY 50 daily forecast at a glance
| Date | Expected market behaviour | Important reversal timings |
|---|---|---|
| Monday, 2 November | Initial strength followed by possible weakness as the session progresses | 11:00 AM, 12:40 PM, 2:30 PM |
| Tuesday, 3 November | Two-sided movement, with bearish windows during the middle and later session | 10:50 AM, 12:40 PM, 2:20 PM |
| Wednesday, 4 November | Potential sudden spike between 11:00 AM and 1:00 PM, followed by possible profit booking | 10:50 AM, 11:25 AM, 12:40 PM, 2:20 PM |
| Thursday, 5 November | Mild bullish tendency, with the market potentially settling over time | 10:50 AM, 11:25 AM, 12:30 PM, 1:20 PM, 2:20 PM |
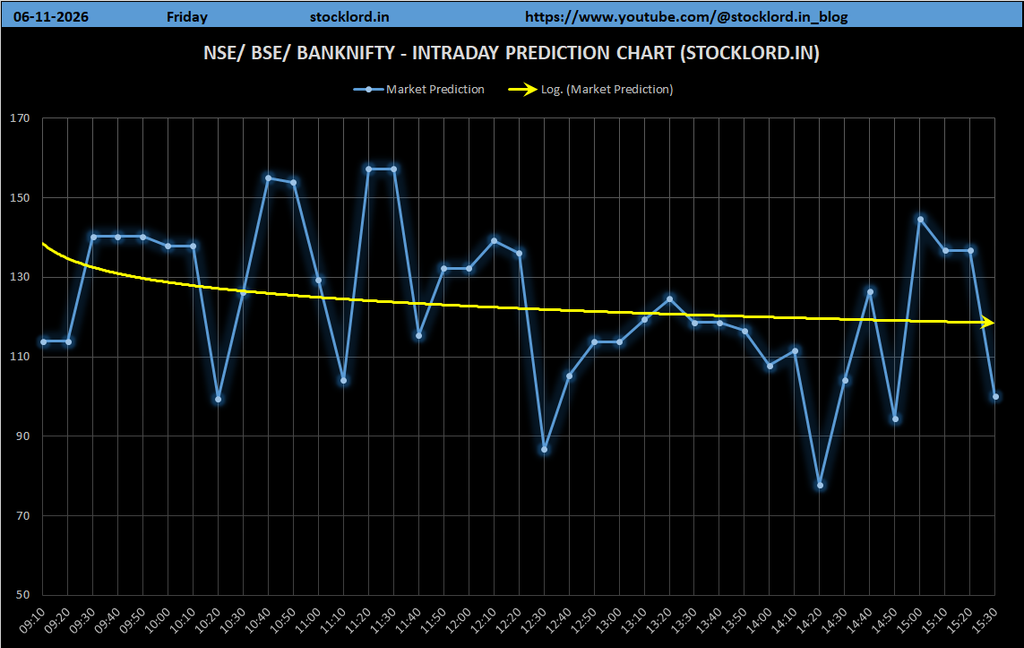
| Friday, 6 November | Higher possibility of positive market behaviour | 10:00 AM, 10:40 AM, 12:30 PM, 2:10 PM |
All timings are interpreted as Indian Standard Time (IST).
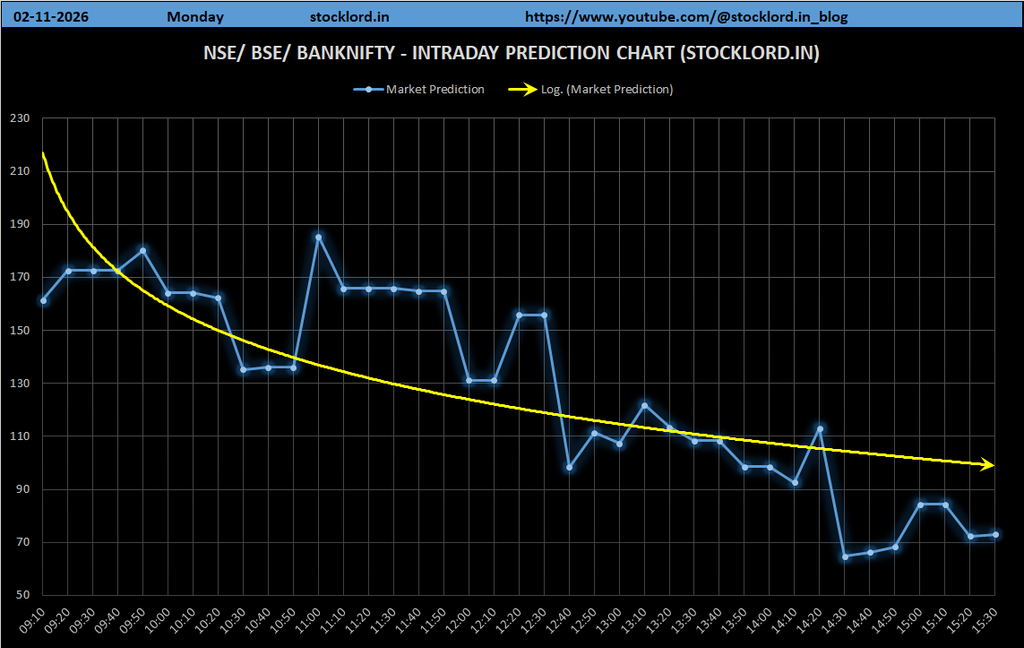
Monday, 2 November 2026: Volatility, Initial Strength and Possible Weakness
The first trading day of the week may experience considerable volatility, according to the supplied forecast.
The Moon is in Ashlesha Nakshatra, which the analysis identifies as a Mars Nakshatra. Mars is described as debilitated and receiving Vedha from Rahu.
This combination is associated in the supplied astrological interpretation with a high possibility of market volatility.
The forecast suggests that the market may initially show strength but could lose momentum as the session progresses. This creates the possibility of an early positive move followed by selling pressure.
Important reversal timings:
- 11:00 AM
- 12:40 PM
- 2:30 PM
What traders can watch:
- Whether the market sustains its initial strength.
- Whether buying momentum weakens around the identified timings.
- Whether the index starts moving toward nearby support levels.
- Whether a late-session decline develops after an initially positive move.
Forecast bias: Volatile opening conditions, with possible loss of strength during the session.
Tuesday, 3 November 2026: Two-Sided Movement and Bearish Windows
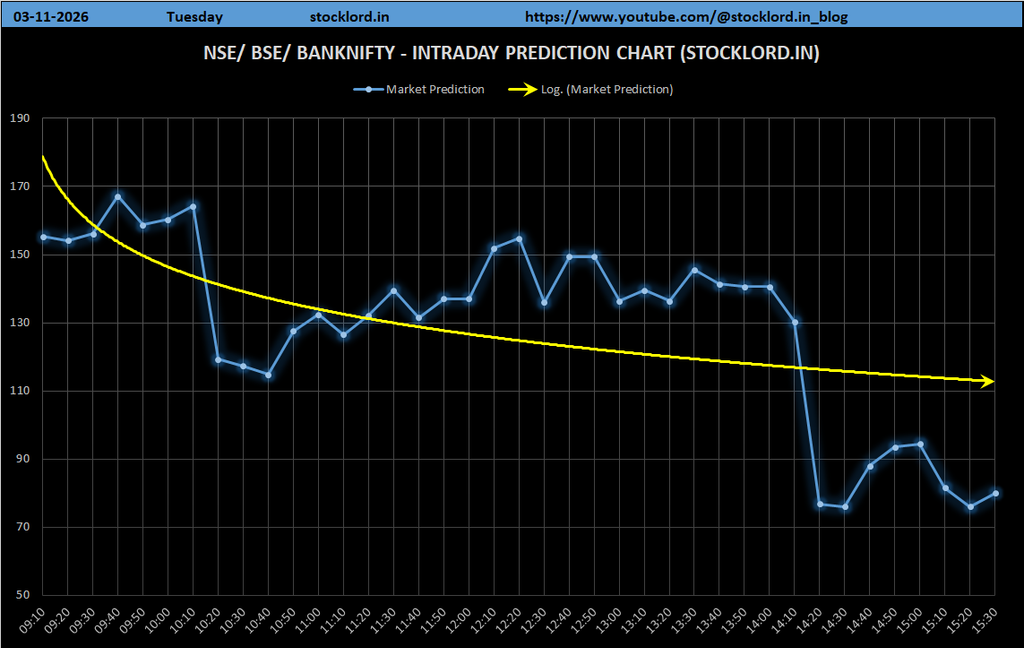
Tuesday’s forecast highlights the Moon sharing Magha Nakshatra with Jupiter and Ketu.
The supplied analysis expects the market to move in both directions, creating the possibility of intraday volatility rather than a smooth directional trend.
Two periods are specifically identified as potentially bearish:
- 11:00 AM to 12:30 PM
- 2:20 PM until the end of the session
These windows may be important for traders monitoring changes in buying and selling pressure.
Important reversal timings:
- 10:50 AM
- 12:40 PM
- 2:20 PM
What traders can watch:
The market may experience fluctuations during the session. Traders can observe whether the bearish windows lead to a sustained decline or whether the index recovers after temporary weakness.
A move below support should be assessed against the next listed support level rather than assuming that the decline will continue indefinitely.
Forecast bias: Two-sided movement with potentially stronger bearish pressure during the identified windows.
Wednesday, 4 November 2026: Sudden Mid-Session Spike and Profit Booking
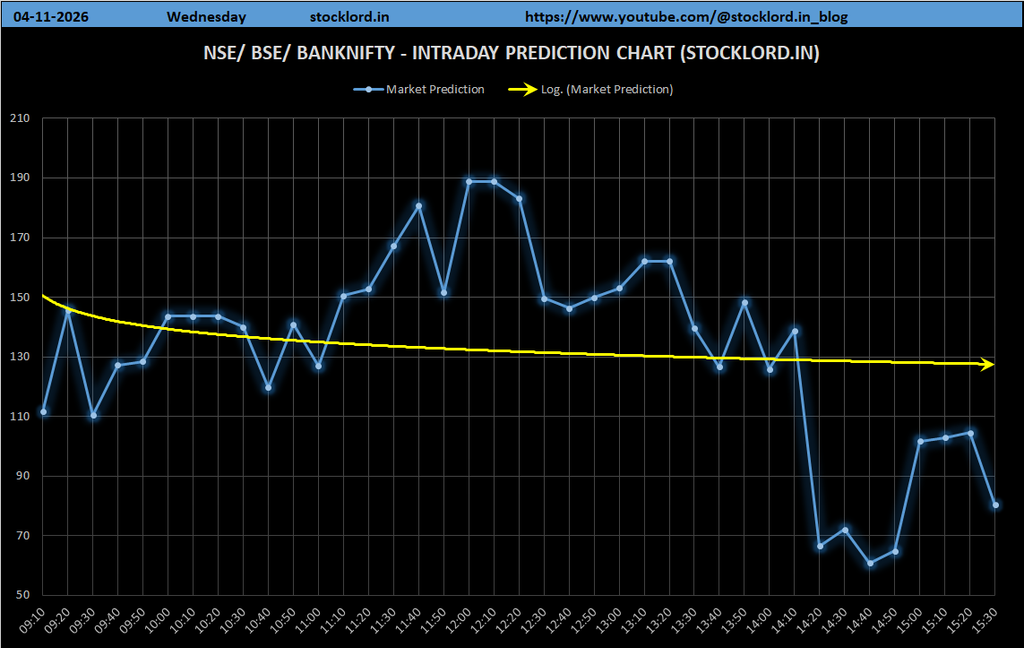
Wednesday’s forecast highlights the possibility of a sudden upward spike during the middle of the trading session.
The expected positive window is approximately 11:00 AM to 1:00 PM. However, the supplied analysis also suggests that profit booking may appear toward the end of the session.
This creates a possible pattern of mid-session strength followed by some reduction in gains.
Important timings:
- 10:50 AM
- 11:25 AM
- 12:40 PM
- 2:20 PM
What traders can watch:
- Whether buying activity increases around the 11:00 AM period.
- Whether the market sustains the sudden upward movement.
- Whether resistance levels restrict further gains.
- Whether profit booking develops during the later session.
A sharp upward move should not automatically be interpreted as the beginning of a sustained bullish trend. Confirmation from price action is important.
Forecast bias: Potential mid-session spike, followed by possible profit booking.
Thursday, 5 November 2026: Mild Bullish Sentiment
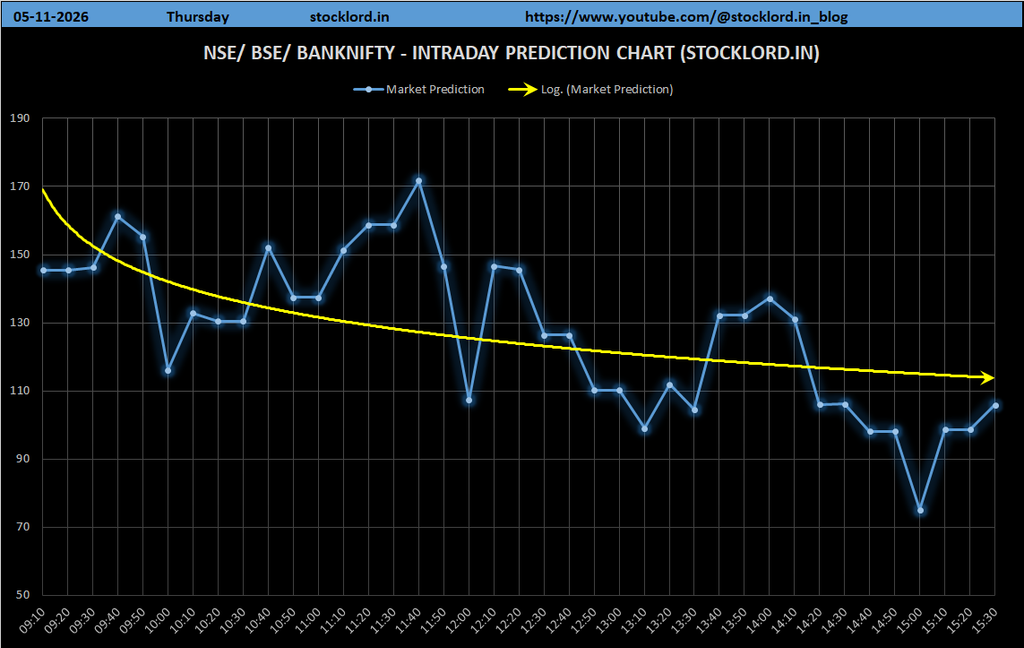
Thursday’s forecast is relatively positive compared with the beginning of the week.
The supplied analysis notes that the Moon receives a semi-sextile aspect from Jupiter and Venus. This configuration is associated with a mild bullish nature in the market.
The forecast also suggests that the market may settle over time, indicating the possibility of a more balanced session rather than an aggressive directional move throughout the day.
Important timings:
- 10:50 AM
- 11:25 AM
- 12:30 PM
- 1:20 PM
- 2:20 PM
What traders can watch:
Monitor whether the market maintains buying interest around the middle of the session. If NIFTY 50 moves above nearby resistance and holds those levels, it may indicate improving momentum.
If the index fails to sustain higher levels, the mild bullish scenario may turn into consolidation.
Forecast bias: Mildly bullish, with a possibility of the market settling as the session progresses.
Friday, 6 November 2026: Higher Possibility of a Positive Market
Friday’s forecast suggests that the market has a majority chance of remaining positive.
The Moon will be in Hasta Nakshatra, according to the supplied data. The analysis associates this configuration with a higher probability of positive market behaviour.
The day is also important from the broader planetary calendar because Venus is expected to move back into Virgo in retrograde motion on 6 November.
Important timings:
- 10:00 AM
- 10:40 AM
- 12:30 PM
- 2:10 PM
What traders can watch:
- Whether the market maintains positive momentum from the beginning.
- Whether buying interest continues around the identified timings.
- Whether NIFTY 50 sustains movement above nearby resistance levels.
- Whether the market closes firmly relative to the weekly reference.
Forecast bias: Potentially positive market behaviour.
NIFTY 50 Support and Resistance Levels: 2–6 November 2026
The supplied data provides multiple intraday support and resistance levels for NIFTY 50.
These levels can be used as reference zones to observe possible market reactions during the week.
NIFTY 50 intraday levels
| Intraday support | Intraday resistance |
|---|---|
| 23,057 | 23,117 |
| 22,997 | 23,177 |
| 22,907 | 23,267 |
| 22,787 | 23,387 |
| 22,607 | 23,567 |
| 22,337 | 23,837 |
| 22,037 | 24,137 |
| 21,677 | 24,497 |
| 21,227 | 24,947 |
| 20,747 | 25,427 |
| 20,207 | 25,967 |
Important NIFTY 50 levels to monitor
Near-term reference zone: 23,057–23,117
The first listed support and resistance levels create a narrow reference zone around 23,087.
If the index holds above the nearby resistance level, traders may monitor the next resistance zones for further upside.
If the index breaks below the nearby support level, the next listed support levels may become relevant.
Higher resistance references:
- 23,177
- 23,267
- 23,387
- 23,567
- 23,837
Lower support references:
- 22,997
- 22,907
- 22,787
- 22,607
- 22,337
These are supplied reference levels, not guaranteed turning points or price targets.
BANKNIFTY Weekly Prediction: 2–6 November 2026
The supplied data includes a complete set of BANKNIFTY intraday support and resistance levels, along with a weekly closing reference of 54,687.
The source does not provide separate daily directional predictions specifically for BANKNIFTY. Therefore, the following analysis focuses on the technical levels and possible scenarios to monitor.
BANKNIFTY intraday support and resistance levels
| Intraday support | Intraday resistance |
|---|---|
| 54,657 | 54,717 |
| 54,597 | 54,777 |
| 54,507 | 54,867 |
| 54,387 | 54,987 |
| 54,207 | 55,167 |
| 53,937 | 55,437 |
| 53,637 | 55,737 |
| 53,277 | 56,097 |
| 52,827 | 56,547 |
| 52,347 | 57,027 |
| 51,807 | 57,567 |
| 51,177 | 58,197 |
| 50,517 | 58,857 |
| 49,797 | 59,577 |
| 48,987 | 60,387 |
| 48,147 | 61,227 |
| 47,247 | 62,127 |
Important BANKNIFTY levels to watch
The nearest listed support and resistance references are:
- Support: 54,657
- Resistance: 54,717
- Weekly closing reference: 54,687
Potential bullish scenario: If BANKNIFTY sustains above 54,717, the next resistance references are 54,777, 54,867 and 54,987.
Potential bearish scenario: If BANKNIFTY falls below 54,657, the next support references are 54,597, 54,507 and 54,387.
These are conditional scenarios based on the supplied levels. Actual movement will depend on market conditions and price confirmation.
November 2026 Financial Astrology: Important Planetary Transits
Apart from the daily market outlook, the supplied analysis identifies several important planetary developments during November 2026.
These dates may be of interest to traders who follow financial astrology and observe possible relationships between planetary movements and market behaviour.
30 October 2026: Jupiter Transits into Leo
The supplied calendar notes that Jupiter transited into Leo on 30 October 2026.
This transit is included as an important background development entering the November market period.
6 November 2026: Venus Returns to Virgo in Retrograde Motion
According to the supplied data, Venus moves back into Virgo in retrograde motion on 6 November.
This date coincides with the final trading day covered by this weekly forecast.
The source does not specify a guaranteed market direction from this transit, so its significance should be treated as an astrological observation rather than a definite trading signal.
8 November 2026: Moon–Mercury Combination and Possible Market Reversal
The supplied analysis identifies 8 November as a date when the Moon–Mercury combination may give a market reversal.
This date falls on a Sunday, so it is not a regular NSE trading session. It may nevertheless be monitored as an astrological calendar point when assessing subsequent market behaviour.
No specific NIFTY 50 or BANKNIFTY price target is provided for this date.
13 November 2026: Mars Transits into Leo
Mars is expected to transit into Leo on 13 November according to the supplied calendar.
This is another important date to note for traders following planetary movements and their possible relationship with market sentiment.
23 November 2026: Venus Returns to Libra
The supplied analysis identifies 23 November as the date when Venus comes back to Libra.
This is included as another important planetary development for the second half of November.
Venus–Jupiter Sextile: Important for Gold and NIFTY 50
The source specifically highlights the Venus–Jupiter sextile as important for the Gold chart and NIFTY 50.
However, it does not provide a precise date, price target or directional market prediction for this aspect.
It is therefore best treated as a planetary configuration to monitor rather than as a standalone bullish or bearish signal.
November 2026 Market Trend: Historical Analysis
One of the most important observations in the supplied data is the historical market tendency identified for November.
According to the supplied historical analysis, the month may be divided into three broad phases.
Phase 1: 1–7 November — Potentially Bullish Tendency
The supplied data suggests that the market may remain bullish up to 7 November.
This broadly corresponds with the positive possibilities identified for 5 and 6 November in the weekly outlook, although the first part of the week may still experience volatility and bearish pressure.
Phase 2: 7–19 November — Potentially Bearish Tendency
The second phase is identified as potentially bearish.
This period includes the Moon–Mercury reversal observation on 8 November and Mars’s transit into Leo on 13 November.
The supplied analysis does not give daily market predictions for every date in this period. The broader bearish tendency should therefore be treated as a historical observation, not a guaranteed decline.
Phase 3: 20–30 November — Potentially Bullish Tendency
The final phase of November is identified as potentially bullish.
The source also notes Venus returning to Libra on 23 November and highlights the Venus–Jupiter sextile as important for Gold and NIFTY 50.
This creates an interesting period to observe for traders following the supplied financial astrology framework.
November market trend summary
| Period | Historical tendency in supplied data |
|---|---|
| Up to 7 November | Potentially bullish |
| 7–19 November | Potentially bearish |
| 20–30 November | Potentially bullish |
These phases are based on the historical tendency stated in the supplied analysis. They should not be interpreted as statistically verified probabilities or certain market outcomes.
Weekly Market Outlook: Bullish or Bearish?
The 2–6 November forecast suggests that the market may begin with volatility and weakness before showing improving sentiment toward the end of the week.
The daily outlook can be summarized as follows:
- 2 November: Initial strength may fade as the session progresses.
- 3 November: Market may move in both directions, with bearish periods during the middle and later session.
- 4 November: A sudden upward spike may occur during the middle of the session, followed by possible profit booking.
- 5 November: Mild bullish sentiment may develop, with the market settling over time.
- 6 November: Higher possibility of positive market behaviour.
The overall pattern suggests that traders may need to be especially cautious during the first half of the week, while watching for improving sentiment on Thursday and Friday.
However, the forecast does not guarantee that the market will close higher.
Important Intraday Reversal Timings: 2–6 November 2026
The supplied financial astrology analysis identifies several important timings during each trading session.
| Date | Important timings |
|---|---|
| 2 November | 11:00 AM, 12:40 PM, 2:30 PM |
| 3 November | 10:50 AM, 12:40 PM, 2:20 PM |
| 4 November | 10:50 AM, 11:25 AM, 12:40 PM, 2:20 PM |
| 5 November | 10:50 AM, 11:25 AM, 12:30 PM, 1:20 PM, 2:20 PM |
| 6 November | 10:00 AM, 10:40 AM, 12:30 PM, 2:10 PM |
These timings represent observation windows from the supplied astrology forecast. They do not mean that a reversal must happen at the exact minute.
Traders can compare price behaviour around these timings with the relevant support and resistance levels to assess whether a meaningful change in market momentum is developing.
How Traders Can Use This Weekly Forecast
This weekly analysis can be used as a market-planning reference, especially by traders who combine financial astrology with technical analysis.
A disciplined approach may include the following:
1. Mark the important support and resistance levels
Identify the relevant NIFTY 50 and BANKNIFTY levels before the trading session begins.
2. Observe the reversal timings
Pay attention to the listed intraday windows, but do not treat them as automatic buy or sell signals.
3. Watch for early strength and weakness
Monday’s forecast specifically suggests initial strength followed by possible weakness. Observe whether actual price action confirms this scenario.
4. Monitor the Tuesday bearish windows
The 11:00 AM–12:30 PM and 2:20 PM–end-of-session periods are identified as potentially bearish. Watch for confirmation rather than assuming a decline.
5. Track Wednesday’s potential spike
If the market rises sharply during the middle of Wednesday’s session, observe whether it sustains the move or experiences profit booking.
6. Watch Thursday and Friday for improving sentiment
The supplied forecast is more positive for these two sessions. Sustained price movement above resistance may provide stronger evidence of improving momentum.
7. Manage trading risk
Define invalidation levels and position sizes before entering a trade. Sudden volatility can lead to rapid price changes, particularly when the market moves against an expected scenario.
8. Treat NIFTY 50 and BANKNIFTY separately
Both indices may respond differently to market conditions. Confirm the behaviour of the actual index or instrument being traded.
Frequently Asked Questions (FAQs)
1. What is the NIFTY 50 prediction for 2–6 November 2026?
The supplied forecast suggests initial strength followed by possible weakness on Monday, two-sided movement with bearish windows on Tuesday, a potential mid-session spike on Wednesday, mild bullishness on Thursday and a higher possibility of positive market behaviour on Friday.
2. What is the NIFTY 50 weekly closing reference?
The supplied NIFTY 50 weekly closing reference is 23,087.
3. What is the BANKNIFTY weekly closing reference?
The supplied BANKNIFTY weekly closing reference is 54,687.
4. What are the important NIFTY 50 reversal timings this week?
The important timings vary by day. They include 11:00 AM, 12:40 PM and 2:30 PM on Monday, with the complete daily schedule provided in the article.
5. What are the important BANKNIFTY support and resistance levels?
The nearest supplied BANKNIFTY support is 54,657 and the nearest resistance is 54,717. Additional levels are listed in the BANKNIFTY technical levels table.
6. Is the market expected to be bullish or bearish in November 2026?
The supplied historical analysis suggests a potentially bullish tendency up to 7 November, a bearish tendency from 7–19 November, and another bullish tendency from 20–30 November.
7. What is the significance of Venus moving back into Virgo on 6 November?
The supplied astrological calendar identifies Venus returning to Virgo in retrograde motion on 6 November. It is an important date within the analysis, but the source does not specify a guaranteed market reaction.
8. Can the Moon–Mercury combination cause a market reversal on 8 November?
The supplied analysis identifies 8 November as a possible market reversal date associated with the Moon–Mercury combination. This is an astrology-based observation, not a confirmed market prediction.
9. What is the significance of Mars transiting into Leo on 13 November?
The supplied calendar identifies 13 November as the date of Mars’s transit into Leo. It is included as an important planetary event to observe during the month.
10. Can financial astrology accurately predict stock market movements?
Financial astrology is speculative and is not a scientifically established standalone method for predicting stock market movements. These observations should be combined with live market information and appropriate risk management, not used as guaranteed trading signals.
Conclusion: NIFTY 50 and BANKNIFTY Outlook for 2–6 November 2026
The supplied financial astrology forecast points toward a potentially volatile beginning to November, followed by improving market sentiment toward the end of the first trading week.
Monday and Tuesday may experience weakness and two-sided movement, while Wednesday could see a sudden mid-session spike followed by profit booking. Thursday’s outlook is mildly bullish, and Friday has a higher possibility of positive market behaviour.
The key weekly closing references are 23,087 for NIFTY 50 and 54,687 for BANKNIFTY.
The broader November analysis identifies three potential market phases: bullish tendency up to 7 November, bearish tendency from 7–19 November, and bullish tendency from 20–30 November. Important planetary dates include 6 November, 8 November, 13 November and 23 November.
For traders following financial astrology, these dates and intraday timings provide a framework for observing market behaviour. However, actual market direction must be assessed through price action, technical levels and prevailing financial conditions.
Use this forecast as an informational guide, verify all levels against live market data, and follow disciplined risk management.
