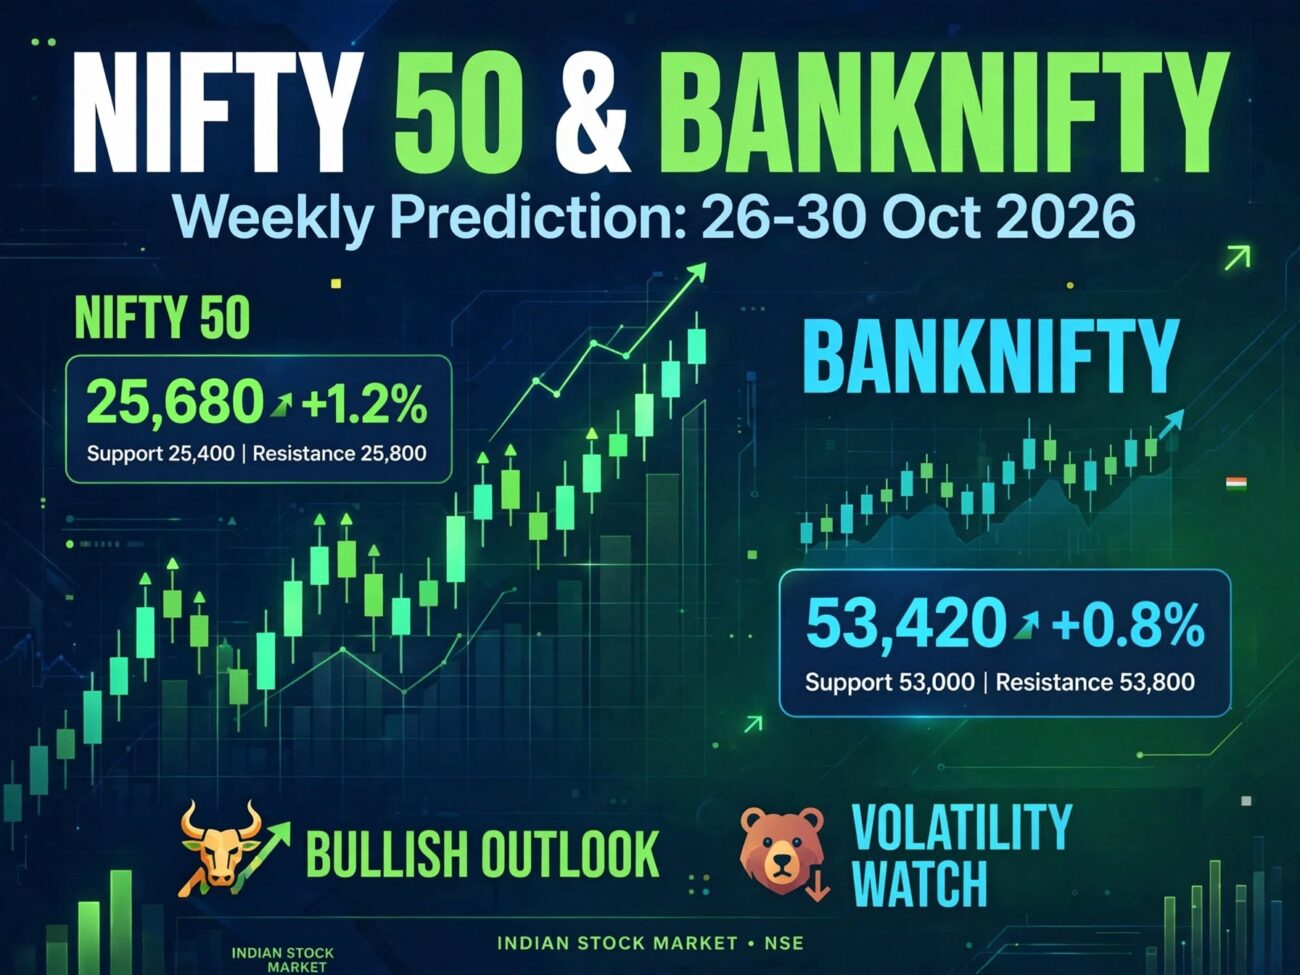
Introduction: Indian Stock Market Outlook for 26–30 October 2026
The Indian stock market enters the final trading week of October 2026 with a mixed daily outlook and a potentially positive weekly closing bias, according to the supplied financial astrology analysis.
The forecast for 26–30 October 2026 highlights possible morning weakness on Monday, a recovery in buying sentiment around midday, a positive phase followed by late-session bearishness on Tuesday, and potentially positive conditions on Wednesday, Thursday and Friday. The analysis also suggests that the week could close in a positive direction despite the Moon remaining in Paap Kartari throughout the week.
Alongside the astrological outlook, the supplied data identifies important intraday reversal timings and multiple support and resistance levels for NIFTY 50 and BANKNIFTY.
The weekly closing reference levels are:
- NIFTY 50: 22,600
- BANKNIFTY: 54,287
Another date to watch in the supplied astrology calendar is 31 October 2026, when Jupiter is noted as transiting into Leo.
This article provides the daily outlook, key intraday timings, index levels and potential scenarios to monitor throughout the week.
Disclaimer: These are speculative financial astrology scenarios based on the supplied data, not verified predictions or guaranteed market outcomes. Always confirm market conditions using reliable live data.
NIFTY 50 Weekly Prediction: 26–30 October 2026
The supplied forecast suggests that NIFTY 50 could experience weakness at the start of the week before buying sentiment improves. The middle of the week is described as potentially positive, while the overall analysis anticipates a chance of a positive weekly close.
However, the daily outlooks include possible late-session weakness and periods of consolidation. Traders should therefore avoid assuming that a positive weekly bias means every session will rise.
NIFTY 50 daily market outlook at a glance
| Date | Forecast from supplied data | Important timings |
|---|---|---|
| Monday, 26 October | Morning pressure, followed by a possible rise in buying sentiment around 1:00–2:00 PM | 9:30 AM, 11:20 AM, 12:10 PM, 1:10 PM, 3:00 PM |
| Tuesday, 27 October | Potentially positive movement between 11:00 AM and 1:00 PM, followed by bearishness near the end of the session | 10:30 AM, 11:25 AM, 12:20 PM, 1:20 PM, 2:20 PM |
| Wednesday, 28 October | Potentially positive from the opening, with possible settlement or consolidation toward the close | 9:30 AM, 11:20 AM, 12:20 PM, 1:15 PM, 2:50 PM |
| Thursday, 29 October | Positive buying sentiment expected during the 11:00 AM–1:00 PM period | 10:30 AM, 11:25 AM, 12:20 PM, 1:20 PM, 2:15 PM |
| Friday, 30 October | Positive buying sentiment expected during the 11:00 AM–1:00 PM period | 9:20 AM, 11:10 AM, 12:50 PM, 2:40 PM |
All times are interpreted as Indian Standard Time (IST).
Monday, 26 October 2026: Morning Pressure and Afternoon Buying Interest
The supplied analysis suggests that the market may remain under pressure during the morning session. It also notes that the Moon’s sublord is in the 8th and 3rd houses within the framework used by the forecast.
A rise in buying sentiment is anticipated around 1:00 PM to 2:00 PM. This creates a possible shift from early weakness to a stronger afternoon phase, although the actual direction will depend on how the index behaves around its intraday levels.
Important timings:
- 9:30 AM
- 11:20 AM
- 12:10 PM
- 1:10 PM
- 3:00 PM
What to watch: Monitor whether early selling pressure continues or weakens as the session progresses. A recovery around the anticipated afternoon window would need confirmation from price action before being treated as a sustained bullish move.
Forecast bias: Morning pressure, with a possible afternoon improvement in buying sentiment.
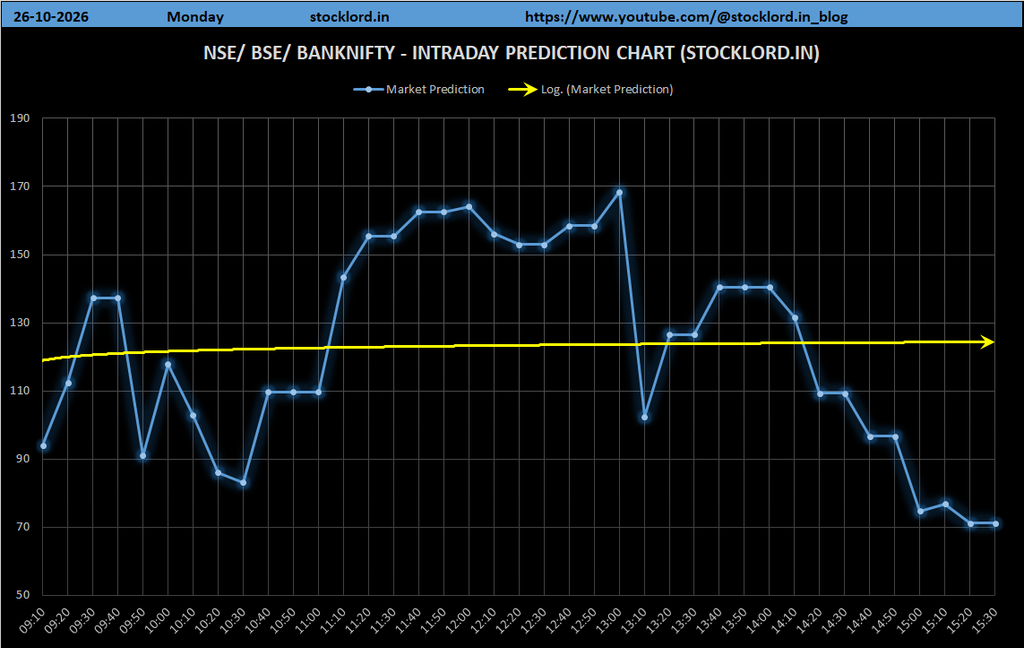
Tuesday, 27 October 2026: Midday Positivity Followed by Possible Late Weakness
Tuesday’s forecast suggests that the market may show positive behaviour between 11:00 AM and 1:00 PM, followed by bearishness toward the end of the session.
This outlook points to the possibility of a session that initially improves before losing momentum later in the day.
Important timings:
- 10:30 AM
- 11:25 AM
- 12:20 PM
- 1:20 PM
- 2:20 PM
What to watch: Traders can monitor whether the index sustains gains during the midday period. If the market begins to weaken later, nearby support levels may become important. If buying remains strong into the close, the anticipated bearish scenario may not materialize.
Forecast bias: Potentially positive midday movement, followed by possible late-session weakness.
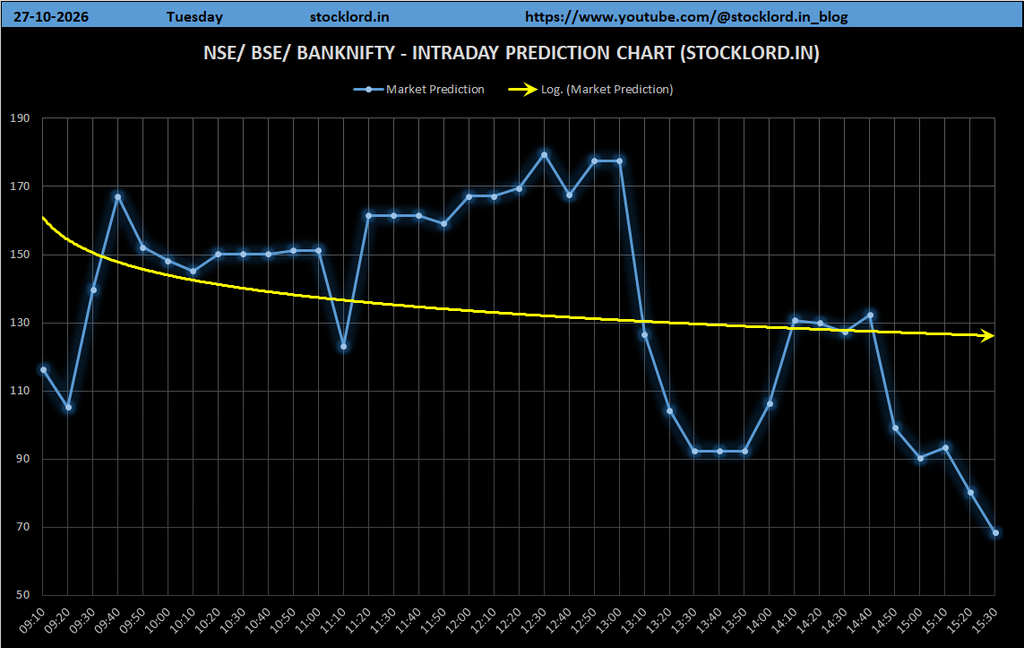
Wednesday, 28 October 2026: Potentially Positive Opening
The supplied forecast expects the market to be positive from the beginning of Wednesday’s session. It also suggests that a settlement or consolidation phase may appear near the end of the day.
This could indicate a session in which the market starts firmly but may see momentum moderate as trading progresses.
Important timings:
- 9:30 AM
- 11:20 AM
- 12:20 PM
- 1:15 PM
- 2:50 PM
What to watch: Observe whether early buying is sustained and whether the index can hold its gains during the later session. A pause or consolidation would not automatically indicate a bearish reversal.
Forecast bias: Potentially positive from the opening, with possible late-session consolidation.
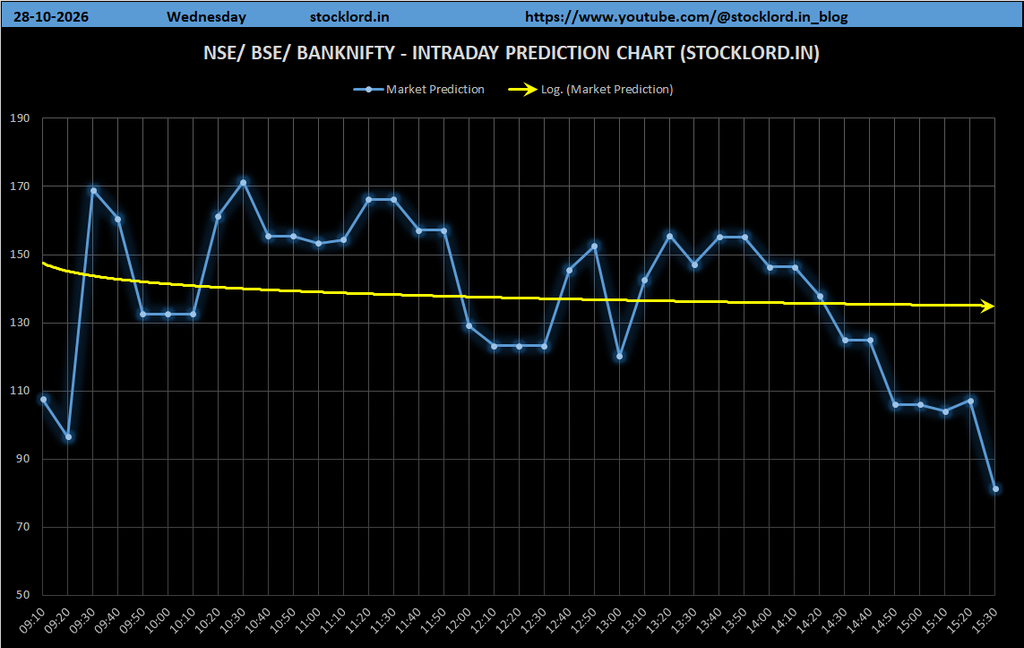
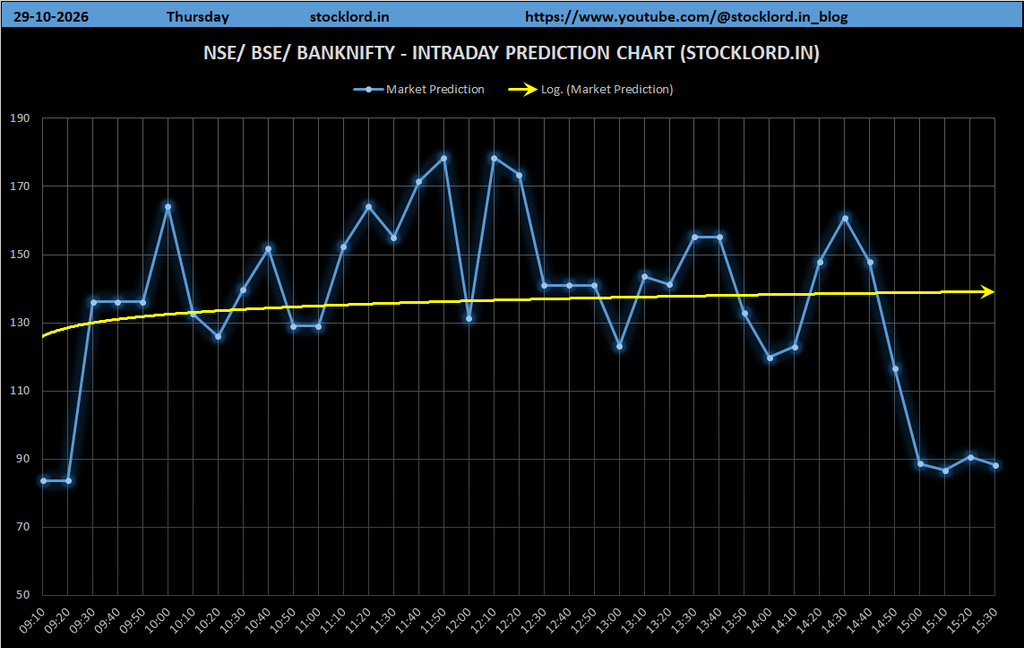
Thursday, 29 October 2026: Positive Buying Sentiment During Mid-Session
Thursday’s forecast highlights a positive buying sentiment during the 11:00 AM to 1:00 PM window.
The supplied analysis does not specify a separate closing direction for the day, so the main focus is the anticipated midday period rather than an assumption that the entire session will be bullish.
Important timings:
- 10:30 AM
- 11:25 AM
- 12:20 PM
- 1:20 PM
- 2:15 PM
What to watch: Look for evidence of sustained buying around the identified time window. If the index moves above nearby resistance and holds the breakout, that may indicate stronger momentum. Rejection at resistance could instead lead to consolidation.
Forecast bias: Potentially positive mid-session buying sentiment.
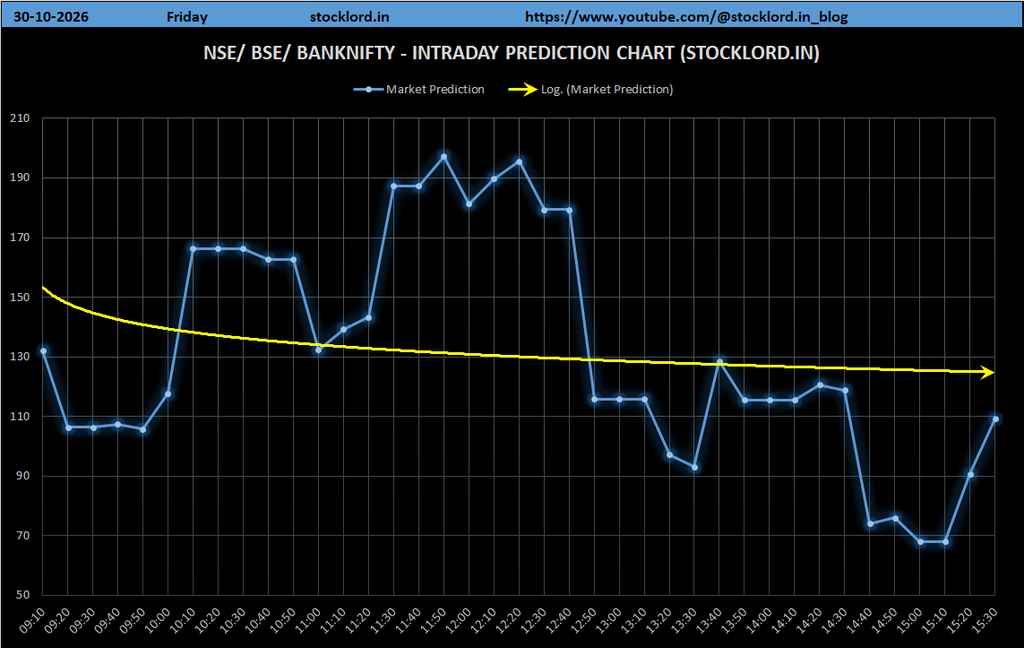
Friday, 30 October 2026: Positive Midday Sentiment and Weekly Closing Focus
The forecast for Friday also expects positive buying sentiment between 11:00 AM and 1:00 PM.
As this is the final trading day covered by the weekly forecast, attention may also turn to how NIFTY 50 and BANKNIFTY behave relative to their supplied weekly closing reference levels.
The analysis suggests that the week has a high chance of closing positively overall. However, it does not guarantee that either index will finish at or above its stated reference level.
Important timings:
- 9:20 AM
- 11:10 AM
- 12:50 PM
- 2:40 PM
What to watch: Monitor whether midday buying is sustained and whether the market holds its gains later in the session. The final direction should be assessed using actual price behaviour rather than the weekly astrology outlook alone.
Forecast bias: Potentially positive mid-session sentiment, with the weekly close in focus.
NIFTY 50 Support and Resistance Levels: 26–30 October 2026
The supplied data includes the following NIFTY 50 intraday support and resistance levels.
NIFTY 50 intraday levels
| Intraday support | Intraday resistance |
|---|---|
| 22,570 | 22,630 |
| 22,510 | 22,690 |
| 22,420 | 22,780 |
| 22,300 | 22,900 |
| 22,120 | 23,080 |
| 21,850 | 23,350 |
| 21,550 | 23,650 |
| 21,190 | 24,010 |
| 20,740 | 24,460 |
| 20,260 | 24,940 |
| 19,720 | 25,480 |
NIFTY 50 weekly closing reference: 22,600
How to interpret the NIFTY 50 levels
Support zones: The listed support levels can be monitored for possible stabilization or buying interest during a decline. A break below a support level may bring the next listed zone into focus, but support is never guaranteed to hold.
Resistance zones: The resistance levels may help identify areas where an upward move could pause or encounter selling pressure. Sustained movement above a resistance zone may suggest improving momentum if supported by price action.
Weekly reference: The supplied closing reference of 22,600 is a benchmark for the week, not a guaranteed target or a confirmed future closing price.
Traders should use these levels alongside live market prices and their own risk-management rules.
BANKNIFTY Weekly Prediction: 26–30 October 2026
The supplied data provides BANKNIFTY with a detailed set of intraday support and resistance levels and a weekly closing reference of 54,287.
It does not provide separate daily directional forecasts specifically for BANKNIFTY. The NIFTY 50 daily outlook should therefore not be automatically applied to the banking index, because the two indices can move differently.
BANKNIFTY intraday support and resistance levels
| Intraday support | Intraday resistance |
|---|---|
| 54,257 | 54,317 |
| 54,197 | 54,377 |
| 54,107 | 54,467 |
| 53,987 | 54,587 |
| 53,807 | 54,767 |
| 53,537 | 55,037 |
| 53,237 | 55,337 |
| 52,877 | 55,697 |
| 52,427 | 56,147 |
| 51,947 | 56,627 |
| 51,407 | 57,167 |
| 50,777 | 57,797 |
| 50,117 | 58,457 |
| 49,397 | 59,177 |
| 48,587 | 59,987 |
| 47,747 | 60,827 |
| 46,847 | 61,727 |
BANKNIFTY weekly closing reference: 54,287
BANKNIFTY levels to monitor
The closest listed support and resistance references are 54,257 and 54,317, respectively.
If BANKNIFTY sustains above nearby resistance, traders may watch the next resistance levels for signs of continuation. If the index falls below nearby support, the next lower listed levels may become relevant.
These are conditional technical scenarios, not guaranteed movements. The supplied material does not establish the probability that BANKNIFTY will reach any particular level during the week.
Weekly Market Outlook: Can the Market Close Positively?
One of the key observations in the supplied data is that the Moon remains in Paap Kartari throughout the week. Despite this condition, the analysis suggests a high chance of a positive weekly close.
Within the supplied astrology framework, this creates a distinction between possible intraday fluctuations and the overall weekly direction. The forecast includes morning pressure and late-session bearishness on some days, while anticipating positive buying sentiment during several midday periods.
The overall outlook can be summarized as follows:
- Monday: Possible morning pressure followed by an afternoon improvement.
- Tuesday: Potentially positive midday movement, with possible late-session weakness.
- Wednesday: Potentially positive opening, followed by possible consolidation.
- Thursday: Positive buying sentiment during the middle of the session.
- Friday: Positive buying sentiment during the middle of the session, with attention on the weekly close.
This pattern is consistent with a mixed daily outlook and a positive weekly bias within the source’s interpretation. It should not be mistaken for evidence that the market must rise.
Financial Astrology and the Significance of 31 October 2026
The supplied forecast identifies 31 October 2026 as an important date because Jupiter is expected, within the source’s astrological framework, to transit into Leo.
This date falls on a Saturday, outside the Monday-to-Friday forecast window covered in the article. It is therefore best treated as a separate astrological calendar point rather than as a regular trading session in the weekly outlook.
The source does not specify a separate market target, direction or exact reversal timing for this transit. Any claim that the transit will necessarily cause a market rally or decline would go beyond the supplied data.
For readers following financial astrology, the date may be noted for observation and subsequent comparison with actual market behaviour.
Important Intraday Reversal Timings for the Week
The supplied timings identify periods when traders following the forecast may wish to pay closer attention to price movement.
| Date | Timings to monitor |
|---|---|
| 26 October | 9:30 AM, 11:20 AM, 12:10 PM, 1:10 PM, 3:00 PM |
| 27 October | 10:30 AM, 11:25 AM, 12:20 PM, 1:20 PM, 2:20 PM |
| 28 October | 9:30 AM, 11:20 AM, 12:20 PM, 1:15 PM, 2:50 PM |
| 29 October | 10:30 AM, 11:25 AM, 12:20 PM, 1:20 PM, 2:15 PM |
| 30 October | 9:20 AM, 11:10 AM, 12:50 PM, 2:40 PM |
These are observation windows supplied by the forecast, not confirmed reversal times. Market reversals can occur earlier, later or not at all.
A practical approach is to compare price action around these times with the relevant support and resistance zones. A timing window alone is not a sufficient reason to enter a trade.
Practical Trading Considerations for the Week
The weekly forecast can serve as a planning reference, but traders should combine it with current market information.
1. Prepare support and resistance levels in advance
Mark the levels relevant to the index being traded. Avoid assuming that every listed level will be reached.
2. Observe the expected intraday windows
Use the listed times as reminders to monitor price behaviour, not as automatic buy or sell signals.
3. Confirm directional movement
Look for sustained price action around important levels before interpreting a move as a breakout, breakdown or reversal.
4. Plan risk before entering a trade
Define the conditions under which a trading idea would be invalidated. Position size should reflect the potential loss and the volatility of the instrument.
5. Treat each index independently
NIFTY 50 and BANKNIFTY may not move in the same direction. Check the index you intend to trade rather than assuming one confirms the other.
6. Account for unexpected market events
Economic releases, company announcements, global markets, interest-rate expectations and sudden changes in sentiment can affect prices independently of astrological forecasts.
7. Avoid treating the weekly bias as a certainty
The forecast anticipates a possible positive weekly close, but intraday weakness or a different final outcome remains possible.
Frequently Asked Questions (FAQs)
1. What is the NIFTY 50 prediction for 26–30 October 2026?
The supplied forecast describes possible morning pressure on Monday, positive midday behaviour followed by potential late weakness on Tuesday, a positive opening on Wednesday, and positive buying sentiment during the middle of Thursday and Friday’s sessions. The overall weekly outlook suggests a chance of a positive close.
2. What is the NIFTY 50 weekly closing reference?
The supplied NIFTY 50 weekly closing reference is 22,600. This is a reference value, not a guaranteed closing price.
3. What is the BANKNIFTY weekly closing reference?
The supplied BANKNIFTY weekly closing reference is 54,287.
4. What are the important NIFTY 50 reversal timings this week?
The timings vary by day and are listed in the weekly reversal timing table. They range from 9:20 AM to 3:00 PM IST.
5. Is the weekly market outlook bullish or bearish?
The supplied analysis leans toward a potentially positive weekly close, even though it anticipates pressure or bearish behaviour during parts of some sessions. This is a forecast scenario rather than a confirmed market direction.
6. What is the significance of Jupiter’s transit on 31 October 2026?
The supplied data identifies Jupiter’s transit into Leo as an important astrological date. It does not specify a guaranteed market reaction or a separate price target associated with the transit.
7. Are the support and resistance levels guaranteed?
No. These are reference levels provided in the source. Actual price behaviour may differ, and levels can fail during strong market movements.
8. Can financial astrology be used as the only basis for trading?
It is not advisable to rely on financial astrology alone. It lacks robust scientific validation as a standalone method of predicting market movements. Any trading decision should account for live market data, risk tolerance and a clearly defined risk-management plan.
Conclusion: NIFTY 50 and BANKNIFTY Outlook for 26–30 October 2026
The supplied financial astrology analysis points to a mixed but potentially positive week for the Indian stock market from 26 to 30 October 2026. The forecast anticipates morning pressure on Monday, a midday positive phase followed by possible weakness on Tuesday, a potentially positive Wednesday opening, and positive buying sentiment during the middle sessions on Thursday and Friday.
The principal weekly closing references are 22,600 for NIFTY 50 and 54,287 for BANKNIFTY. Traders can also monitor the supplied intraday support and resistance levels and the daily reversal timing windows.
The forecast further identifies 31 October 2026 as an important astrological date due to Jupiter’s noted transit into Leo.
Ultimately, the market’s actual direction will be determined by real trading activity and prevailing conditions. Use this article for informational planning, verify the levels against live data, and apply disciplined risk management rather than relying on any forecast as a certainty.
