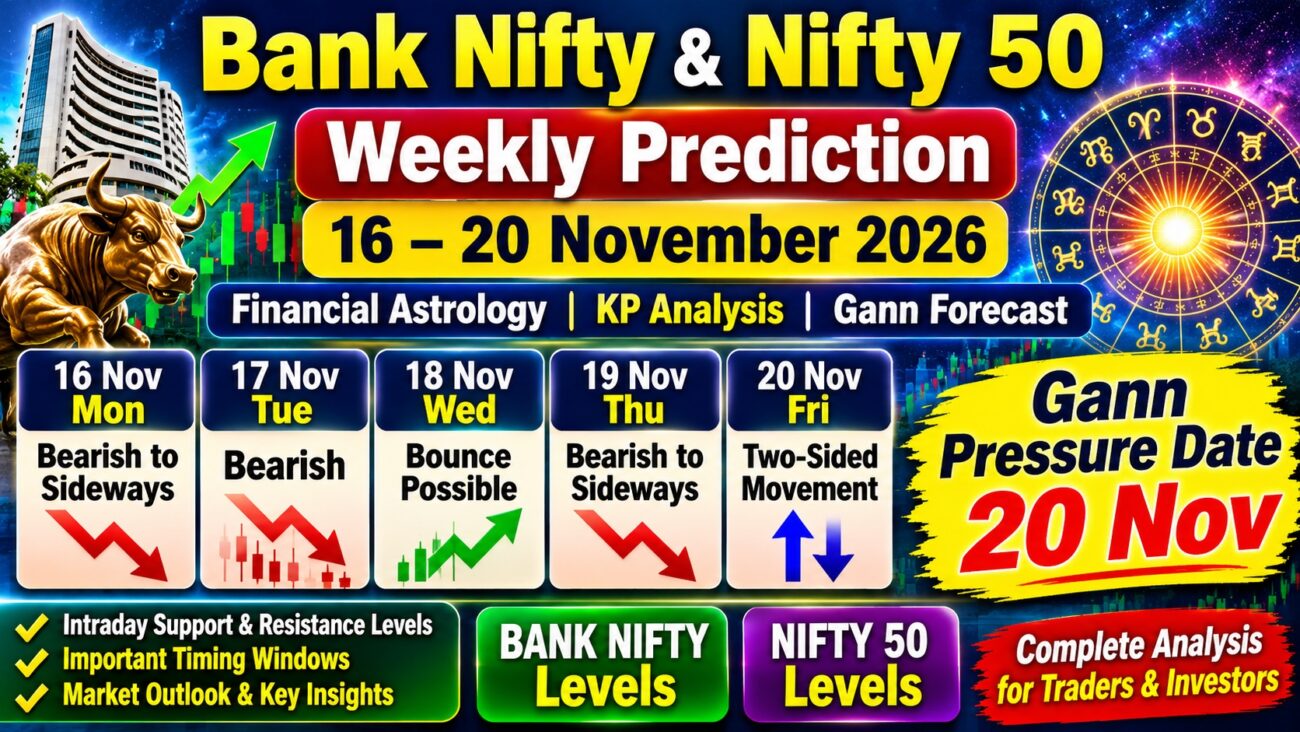
Welcome to the detailed weekly stock market analysis for Bank Nifty and Nifty 50 from 16 November to 20 November 2026.
This weekly market outlook is based on Financial Astrology, KP Astrology Sublord Analysis, planetary conjunctions, D9 chart observations, Moon Nakshatra analysis, intraday timing windows, and Gann-based market pressure date studies.
The upcoming trading week may present a combination of bearish, sideways, temporary bounce, and two-sided market movements according to the astrological framework used in this analysis.
Special attention is being given to 20 November 2026, which has been identified as an important Gann Pressure Date in this study.
Along with the daily market outlook, this article provides detailed intraday support and resistance levels for Bank Nifty and Nifty 50, along with the weekly closing reference levels.
Traders and market enthusiasts can use this analysis as an additional research reference while studying market behavior, price action, and potential intraday movement zones.
Join the course on Mastering WD Gann + Financial Astrology. Click here to know the details.
WhatsApp Message: +91-7045289789
Weekly Market Prediction: 16 November to 20 November 2026
The week of 16th November to 20th November 2026 is expected to be an interesting period for market analysis from the perspective of Financial Astrology and Gann techniques.
The major observations for the week include:
- Moon Sublord strength analysis on 16 November.
- Moon-Rahu conjunction and D9 chart observations on 17 November.
- A possible temporary market bounce on 18 November.
- Bearish-to-sideways market tendencies on 19 November.
- Two-sided market movement on 20 November.
- 20 November as an important Gann Pressure Date.
- Detailed Bank Nifty and Nifty 50 intraday support and resistance levels.
Weekly Market Outlook at a Glance
| Date | Market Outlook | Important Observation |
|---|---|---|
| 16 November 2026 | Bearish to Sideways | Moon Sublord strength and Shravana Nakshatra |
| 17 November 2026 | Bearish | Moon-Rahu in Dhanistha Nakshatra and bearish D9 conjunction |
| 18 November 2026 | Temporary Bounce Possible | Moon-Mercury D9 conjunction |
| 19 November 2026 | Bearish to Sideways | D9 conjunction analysis |
| 20 November 2026 | Two-Sided Movement | Important Gann Pressure Date |
The above outlook reflects an astrological research framework and is not a confirmed market direction.
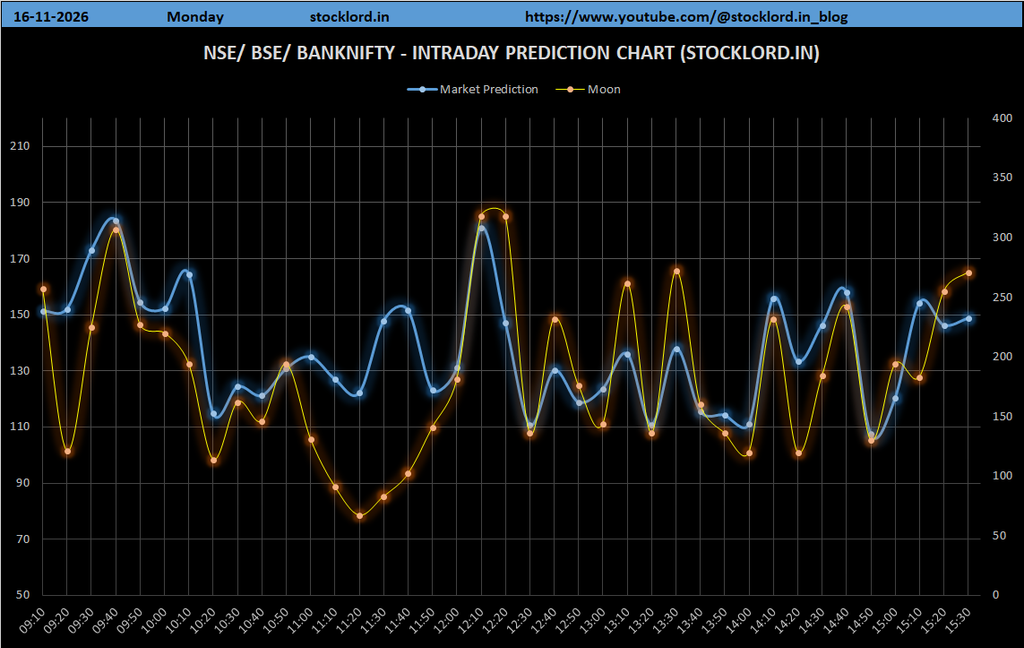
16 November 2026 – Monday Market Prediction
Bank Nifty & Nifty 50 Outlook: Bearish to Sideways
The market outlook for Monday, 16 November 2026, is based on the Sublord strength of the Moon, the Moon’s placement in Shravana Nakshatra, and the Sun’s position in Libra.
According to the astrological interpretation of these factors, the market may experience a bearish-to-sideways tendency during the trading session.
The day may be important for observing price reactions around intraday support and resistance levels.
Astrological Observations
- Moon Sublord strength analysis.
- Moon in Shravana Nakshatra.
- Sun in Libra.
- Potential bearish-to-sideways market tendency.
Important Intraday Timing Windows
| Important Time | Market Observation |
|---|---|
| 10:10 AM | Important timing window |
| 11:50 AM | Potential market movement window |
| 1:30 PM | Important intraday observation |
| 3:10 PM | Late-session market observation |
These timings are intended as observation windows for chart analysis. Actual price movement may occur earlier, later, or not at all.
Trading Research Focus
On this day, traders may closely observe:
- Price reaction at Bank Nifty support and resistance levels.
- Nifty 50 intraday trend strength.
- Whether bearish pressure develops into sideways consolidation.
- Price behavior around the identified timing windows.
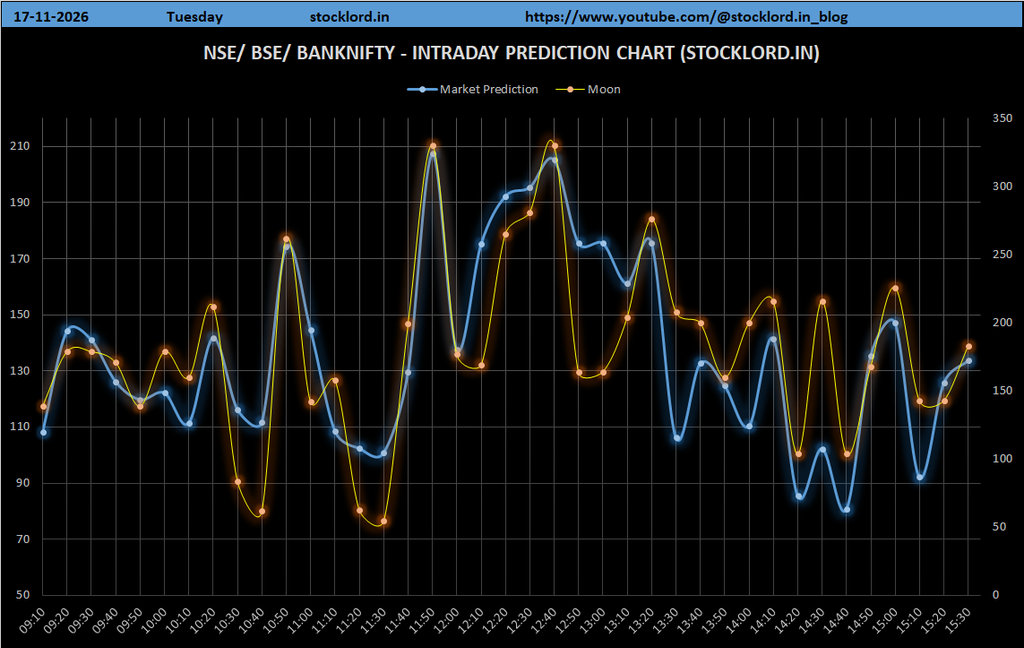
17 November 2026 – Tuesday Market Prediction
Bank Nifty & Nifty 50 Outlook: Bearish Market Tendency
Tuesday, 17 November 2026, is identified as a potentially bearish day in the Financial Astrology framework.
The primary observations are based on the bearish D9 conjunction involving the Moon and the Moon-Rahu placement in Dhanistha Nakshatra.
These astrological factors are interpreted as indicating the possibility of bearish market behavior.
Astrological Observations
- Bearish D9 conjunction involving the Moon.
- Moon-Rahu in Dhanistha Nakshatra.
- Potential bearish market tendency.
Important Intraday Timing Windows
| Important Time | Market Observation |
|---|---|
| 10:30 AM | Important timing window |
| 11:30 AM | Potential movement window |
| 12:25 PM | Intraday observation |
| 1:20 PM | Important market timing |
| 2:15 PM | Late intraday observation |
Trading Research Focus
The major focus for 17 November will be:
- Monitoring bearish momentum.
- Studying support breakdowns and resistance reactions.
- Observing whether the market sustains downside pressure.
- Evaluating price movement near the specified timing windows.
The bearish outlook should be validated with actual market price action rather than assumed in advance.
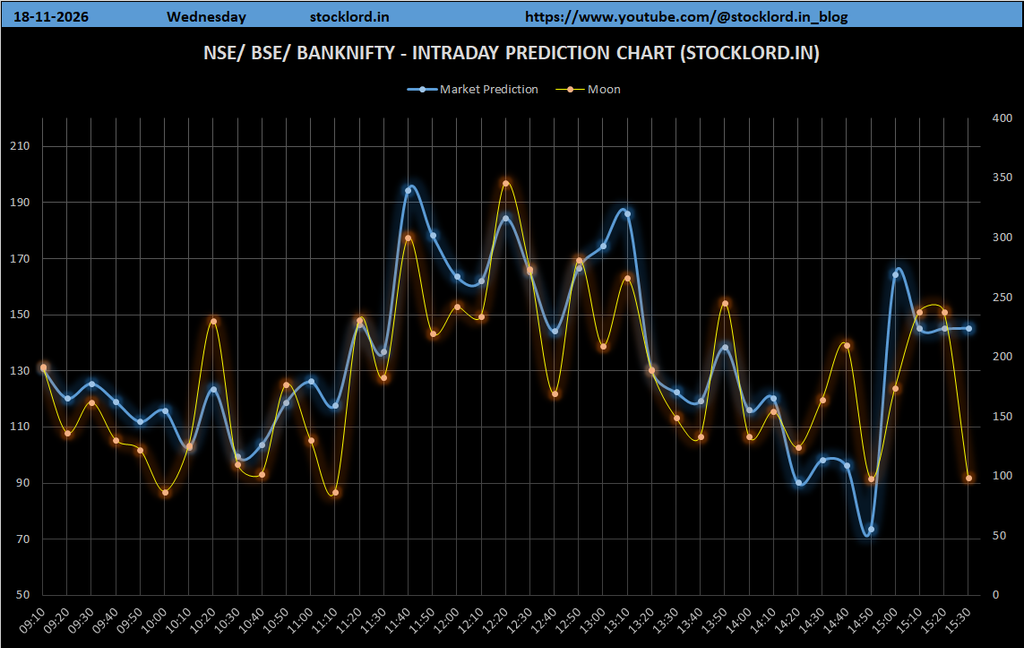
18 November 2026 – Wednesday Market Prediction
Bank Nifty & Nifty 50 Outlook: Temporary Bounce Possible
Wednesday, 18 November 2026, may present a different market behavior compared with the previous two sessions.
Based on the D9 conjunction of the Moon with Mercury, the astrological interpretation suggests the possibility of a temporary bounce in the market.
This could be an important day for observing whether the market experiences a short-term recovery, relief rally, or temporary upward movement.
Astrological Observations
- Moon-Mercury D9 conjunction.
- Potential temporary bounce in the market.
Important Intraday Timing Windows
| Important Time | Market Observation |
|---|---|
| 10:00 AM | Important timing window |
| 11:00 AM | Potential movement window |
| 11:40 AM | Intraday observation |
| 1:20 PM | Important timing |
| 3:00 PM | Late-session observation |
Trading Research Focus
The following factors may be observed:
- Whether Bank Nifty attempts a recovery.
- Whether Nifty 50 experiences a temporary bounce.
- Whether the recovery is sustained or fades.
- Whether resistance levels restrict upward movement.
A temporary bounce does not necessarily indicate a complete trend reversal. Traders should distinguish between short-term recovery and a broader market trend change.
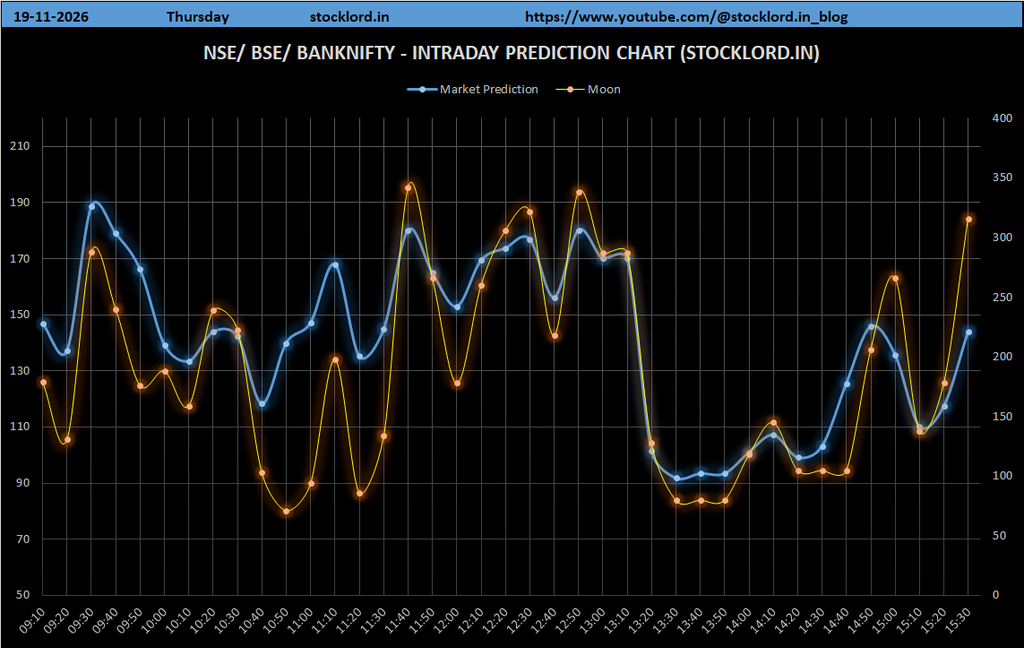
19 November 2026 – Thursday Market Prediction
Bank Nifty & Nifty 50 Outlook: Bearish to Sideways
The market outlook for Thursday, 19 November 2026, is based on D9 conjunction analysis.
According to the interpretation of the planetary conjunctions, the market may show a bearish-to-sideways tendency.
This session may be important for observing consolidation, changes in momentum, and price reactions at the specified intraday levels.
Astrological Observations
- D9 conjunction-based analysis.
- Potential bearish-to-sideways market movement.
Important Intraday Timing Windows
| Important Time | Market Observation |
|---|---|
| 10:30 AM | Important timing window |
| 11:30 AM | Potential movement window |
| 12:25 PM | Intraday observation |
| 1:20 PM | Important market timing |
| 2:15 PM | Late-session observation |
Trading Research Focus
Key areas of observation include:
- Bearish continuation versus sideways consolidation.
- Bank Nifty support level reactions.
- Nifty 50 resistance rejection.
- Potential changes in intraday momentum.
- Price behavior near the specified timing windows.
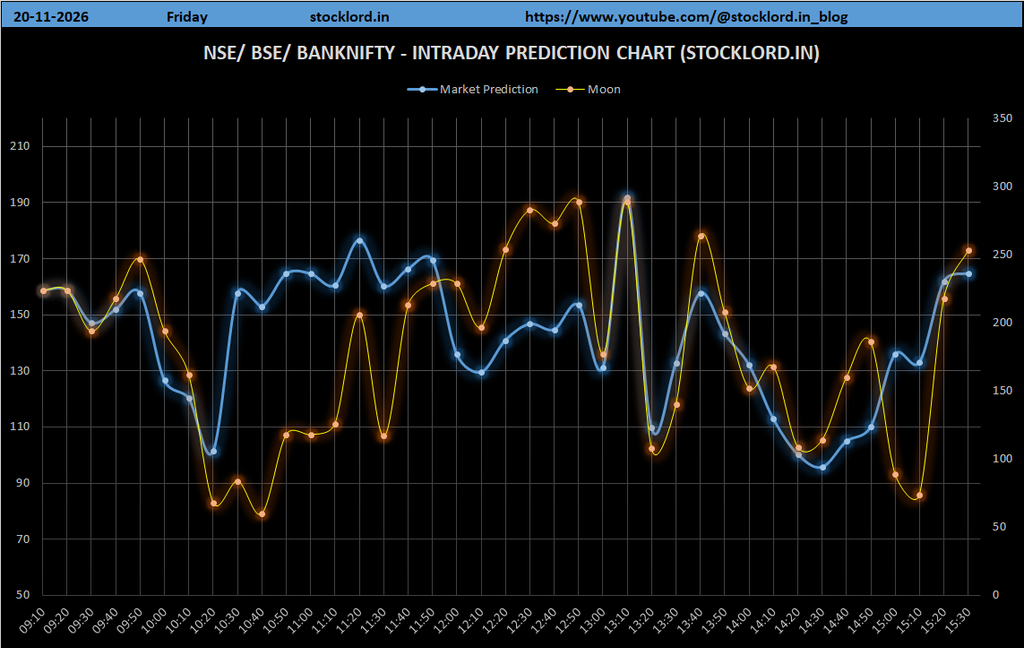
20 November 2026 – Friday Market Prediction
Important Gann Pressure Date – Two-Sided Market Movement
<em>20 November 2026 is identified as an important Gann Pressure Date in this weekly analysis.</em>
Friday, 20 November 2026, may be a significant session for studying market volatility and directional changes.
According to the Gann-based research framework, this date is considered an important pressure date. The expected market behavior is a possible two-sided movement.
A two-sided market movement may involve upward and downward price swings during the same trading session.
The market may experience changes in direction, intraday volatility, or movement between important support and resistance levels.
Gann Pressure Date: 20 November 2026
Important research observations:
- Gann Pressure Date identification.
- Potential two-sided market movement.
- Intraday price fluctuations.
- Important support and resistance reactions.
- Potential changes in market momentum.
Important Intraday Timing Windows
| Important Time | Market Observation |
|---|---|
| 10:00 AM | Important timing window |
| 11:40 AM | Potential movement window |
| 1:20 PM | Intraday observation |
| 3:00 PM | Late-session observation |
Trading Research Focus
On 20 November, traders and market analysts may focus on:
- Whether the market displays two-sided movement.
- Whether Bank Nifty moves between support and resistance zones.
- Whether Nifty 50 experiences intraday directional changes.
- Whether price volatility increases near the specified timing windows.
- Whether the identified Gann Pressure Date corresponds with observable market behavior.
Important: A Gann Pressure Date is a research-based timing reference, not a guarantee of a market crash, reversal, or increased volatility.
Bank Nifty Intraday Support & Resistance Levels – 16 to 20 November 2026
The following Bank Nifty levels are provided as weekly intraday support and resistance reference levels.
These levels can be used for chart observation, price action studies, and market structure analysis during the week.
Support Levels
| No. | Intraday Support |
|---|---|
| 1 | 61,004 |
| 2 | 60,944 |
| 3 | 60,854 |
| 4 | 60,734 |
| 5 | 60,554 |
| 6 | 60,284 |
| 7 | 59,984 |
| 8 | 59,624 |
| 9 | 59,174 |
| 10 | 58,694 |
| 11 | 58,154 |
| 12 | 57,524 |
| 13 | 56,864 |
| 14 | 56,144 |
| 15 | 55,334 |
| 16 | 54,494 |
| 17 | 53,594 |
Resistance Levels
| No. | Intraday Resistance |
|---|---|
| 1 | 61,064 |
| 2 | 61,124 |
| 3 | 61,214 |
| 4 | 61,334 |
| 5 | 61,514 |
| 6 | 61,784 |
| 7 | 62,084 |
| 8 | 62,444 |
| 9 | 62,894 |
| 10 | 63,374 |
| 11 | 63,914 |
| 12 | 64,544 |
| 13 | 65,204 |
| 14 | 65,924 |
| 15 | 66,734 |
| 16 | 67,574 |
| 17 | 68,474 |
Bank Nifty Weekly Closing Reference Level
| Instrument | Weekly Closing Reference |
|---|---|
| Bank Nifty | 61,034 |
The Bank Nifty weekly closing reference level of 61,034 is included as provided in the weekly research data.
Traders may observe how Bank Nifty behaves around the supplied support and resistance levels and compare actual market movement with the weekly outlook.
Nifty 50 Intraday Support & Resistance Levels – 16 to 20 November 2026
The following Nifty 50 levels are provided for intraday market analysis during the week of 16 November to 20 November 2026.
These levels can be used as reference points for studying price reactions, trend continuation, consolidation, and potential breakout or breakdown behavior.
Support Levels
| No. | Intraday Support |
|---|---|
| 1 | 25,114 |
| 2 | 25,054 |
| 3 | 24,964 |
| 4 | 24,844 |
| 5 | 24,664 |
| 6 | 24,394 |
| 7 | 24,094 |
| 8 | 23,734 |
| 9 | 23,284 |
| 10 | 22,804 |
| 11 | 22,264 |
Resistance Levels
| No. | Intraday Resistance |
|---|---|
| 1 | 25,174 |
| 2 | 25,234 |
| 3 | 25,324 |
| 4 | 25,444 |
| 5 | 25,624 |
| 6 | 25,894 |
| 7 | 26,194 |
| 8 | 26,554 |
| 9 | 27,004 |
| 10 | 27,484 |
| 11 | 28,024 |
Nifty 50 Weekly Closing Reference Level
| Instrument | Weekly Closing Reference |
|---|---|
| Nifty 50 | 25,144 |
The Nifty 50 weekly closing reference level of 25,144 is included as provided in the weekly research data.
Market participants can observe the relationship between this reference level and the listed support and resistance zones throughout the week.
How to Use the Weekly Market Analysis
The weekly outlook combines multiple analytical concepts:
1. Financial Astrology
Planetary placements, conjunctions, Nakshatras, and astrological chart observations are used within the research framework to study potential market timing.
2. KP Sublord Analysis
Sublord strength and related KP Astrology concepts are used to develop the daily market outlook.
3. D9 Chart Analysis
D9 conjunction observations are incorporated into the interpretation of potential bearish tendencies and temporary market recovery.
4. Gann Pressure Date Analysis
The identification of 20 November 2026 as an important Gann Pressure Date provides a date-based research reference.
5. Intraday Timing Windows
The listed time windows are intended for monitoring possible changes in market behavior.
6. Support and Resistance Analysis
Bank Nifty and Nifty 50 support and resistance levels provide numerical reference points for chart-based study.
Combining these concepts with actual market price action, volume, trend structure, and risk management can help readers maintain a more disciplined research approach.
Weekly Summary: Bank Nifty & Nifty 50 Outlook
| Date | Expected Market Behavior | Important Times |
|---|---|---|
| 16 Nov 2026 | Bearish to Sideways | 10:10, 11:50, 13:30, 15:10 |
| 17 Nov 2026 | Bearish | 10:30, 11:30, 12:25, 13:20, 14:15 |
| 18 Nov 2026 | Temporary Bounce Possible | 10:00, 11:00, 11:40, 13:20, 15:00 |
| 19 Nov 2026 | Bearish to Sideways | 10:30, 11:30, 12:25, 13:20, 14:15 |
| 20 Nov 2026 | Two-Sided Movement | 10:00, 11:40, 13:20, 15:00 |
Key Highlight of the Week: 20 November 2026 – Important Gann Pressure Date
The week may provide multiple opportunities for studying market behavior through Financial Astrology, KP Astrology, Gann techniques, and intraday support and resistance analysis.
Conclusion: Weekly Stock Market Prediction for 16–20 November 2026
The upcoming trading week from 16 November to 20 November 2026 presents an interesting research outlook for Bank Nifty and Nifty 50.
The daily analysis suggests:
- Monday may show bearish-to-sideways tendencies.
- Tuesday may be bearish according to the Moon-Rahu and D9 conjunction observations.
- Wednesday may present a temporary bounce.
- Thursday may again show bearish-to-sideways movement.
- Friday may experience two-sided movement, with 20 November identified as an important Gann Pressure Date.
The Bank Nifty and Nifty 50 intraday support and resistance levels are provided to support further chart analysis.
The key objective of this weekly market study is to explore the relationship between astrological timing concepts, Gann-based date analysis, and actual market behavior.
Readers should always validate the research outlook with live market conditions, technical indicators, price action, and appropriate risk management.
Stay updated with weekly Bank Nifty and Nifty 50 market analysis, Financial Astrology research, KP Sublord predictions, Gann Pressure Dates, and intraday support and resistance levels.
SEO Meta Title
Bank Nifty & Nifty 50 Prediction 16–20 Nov 2026 | Gann Pressure Date
SEO Meta Description
Bank Nifty and Nifty 50 weekly prediction for 16–20 November 2026. Explore Financial Astrology, KP Sublord analysis, bearish and bullish outlooks, Gann Pressure Date, intraday support and resistance levels.
SEO URL Slug
bank-nifty-nifty-50-prediction-16-20-november-2026
Primary SEO Keywords
- Bank Nifty Prediction 16 November 2026
- Nifty 50 Prediction 16 November 2026
- Bank Nifty Weekly Prediction November 2026
- Nifty 50 Weekly Prediction 2026
- Stock Market Astrology Prediction
- Gann Pressure Date November 2026
- Financial Astrology Market Prediction
- KP Astrology Stock Market Prediction
- Bank Nifty Intraday Support and Resistance
- Nifty 50 Intraday Levels November 2026
Secondary SEO Keywords
- Bank Nifty Prediction 17 November 2026
- Nifty Market Prediction 18 November 2026
- Bank Nifty Prediction 19 November 2026
- Nifty 50 Prediction 20 November 2026
- Gann Market Prediction
- Moon Rahu Stock Market Astrology
- KP Sublord Market Analysis
- Intraday Financial Astrology
- Nifty 50 Support Resistance Levels
- Bank Nifty Weekly Closing Prediction
- Gann Pressure Date Analysis
- November 2026 Stock Market Outlook
Suggested Blog Tags
Bank Nifty, Nifty 50, Financial Astrology, KP Astrology, Gann Astrology, Stock Market Prediction, Intraday Trading, Market Forecast, Gann Pressure Date, Technical Analysis, November 2026 Market Outlook.
Join the course on Mastering WD Gann + Financial Astrology. Click here to know the details.
WhatsApp Message: +91-7045289789
Disclaimer
This article is published for educational, informational, and research purposes only. The market outlook is based on an astrological and Gann-based analytical framework. Financial Astrology, planetary conjunctions, KP Astrology, and Gann Pressure Date analysis are not scientifically established methods of predicting financial market movements.
The directional outlooks, timing windows, and support and resistance levels are not guaranteed to be accurate. Actual market prices may differ significantly from the analysis.
Nothing in this article should be interpreted as investment advice, a recommendation to buy or sell securities, or a guaranteed trading signal. Stock market trading involves substantial financial risk, including the risk of losing capital.
Readers should conduct independent research, verify all numerical levels against live market data, and consult a qualified financial advisor where appropriate before making investment decisions.
