
Introduction: Indian Stock Market Weekly Forecast for 12–16 October 2026
The Indian stock market enters the week of 12–16 October 2026 with several potential intraday turning points highlighted by financial astrology. According to the supplied astrological analysis, NIFTY 50 may experience range-bound trading, bearish pressure, recovery attempts, two-sided volatility, and a possible sudden bounce during the week.
The forecast considers the Moon’s movement through Swati and Vishakha Nakshatras, its association with Mercury and Venus, and the potential timing of intraday reversals. These astrological observations are used to frame a daily market outlook for NIFTY 50 and BANKNIFTY.
The key reference levels provided for the week are 22,520 for NIFTY 50 and 55,256 for BANKNIFTY. Multiple intraday support and resistance levels are also included to help traders identify areas to monitor as price action develops.
This article covers:
- NIFTY 50 weekly prediction for 12–16 October 2026
- BANKNIFTY weekly market outlook
- Daily bullish and bearish possibilities
- Important financial astrology reversal timings
- NIFTY 50 intraday support and resistance levels
- BANKNIFTY intraday support and resistance levels
- Weekly closing reference levels and trading risk considerations
Important: Financial astrology is speculative and is not a scientifically established method of predicting market movements. These forecasts are scenarios for observation, not guaranteed outcomes or personalized investment advice.
NIFTY 50 Weekly Prediction: 12–16 October 2026
NIFTY 50 may experience a mixed trading environment during the week, according to the supplied forecast. The outlook highlights possible reversals on Monday, weakness and recovery on Tuesday, an upward move on Wednesday after initial bearish sentiment, two-sided swings on Thursday, and a possible mid-session bounce on Friday.
NIFTY 50 daily forecast at a glance
| Date | Expected market behaviour | Important reversal timings |
|---|---|---|
| Monday, 12 October | Range-bound movement with a possible trend reversal | 10:20 AM, 11:10 AM, 12:20 PM, 2:10 PM |
| Tuesday, 13 October | Possible weakness, followed by recovery and late-session settlement | 10:20 AM, 12:10 PM, 2:10 PM |
| Wednesday, 14 October | Potential upward movement after initial bearish sentiment | 10:20 AM, 12:10 PM, 2:00 PM, 2:45 PM |
| Thursday, 15 October | Possible decline with swings in both directions | 10:10 AM, 10:45 AM, 12:10 PM, 2:00 PM |
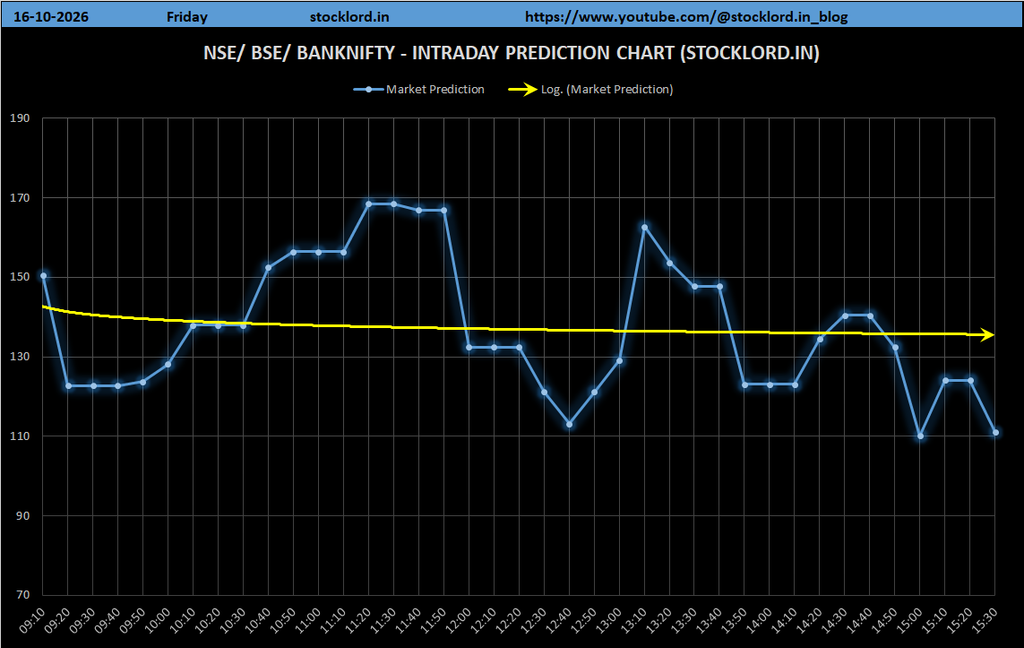
| Friday, 16 October | Potential sudden bounce during the middle part of the session | 10:10 AM, 12:00 PM, 12:40 PM, 1:25 PM, 1:50 PM |
All times are Indian Standard Time (IST), interpreted from the supplied timings.
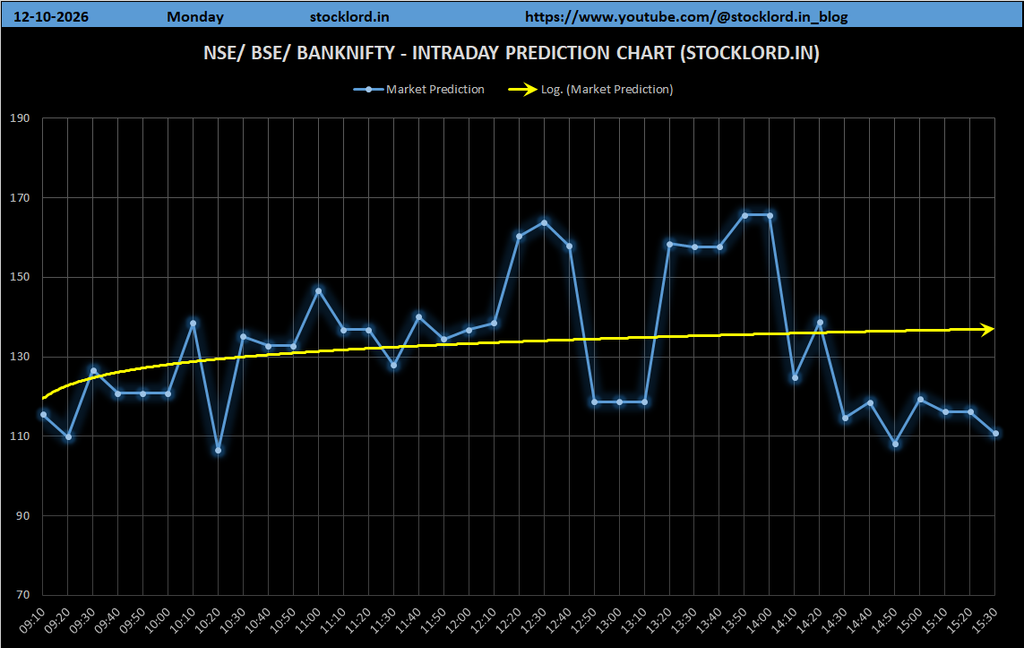
Monday, 12 October 2026: Range-Bound Trading and Possible Trend Reversal
The supplied financial astrology forecast notes that the Moon is in Swati Nakshatra alongside Mercury and Venus. This combination is associated in the analysis with the possibility of a trend reversal.
NIFTY 50 may remain range-bound during the session, with traders watching for changes in intraday momentum rather than assuming a sustained move in one direction.
Important reversal timings:
- 10:20 AM
- 11:10 AM
- 12:20 PM
- 2:10 PM
What traders can watch: Observe whether NIFTY 50 holds its intraday support zones or faces rejection near resistance. A breakout or breakdown should be evaluated alongside price action and trading volume.
Market bias: Range-bound, with potential reversal points.
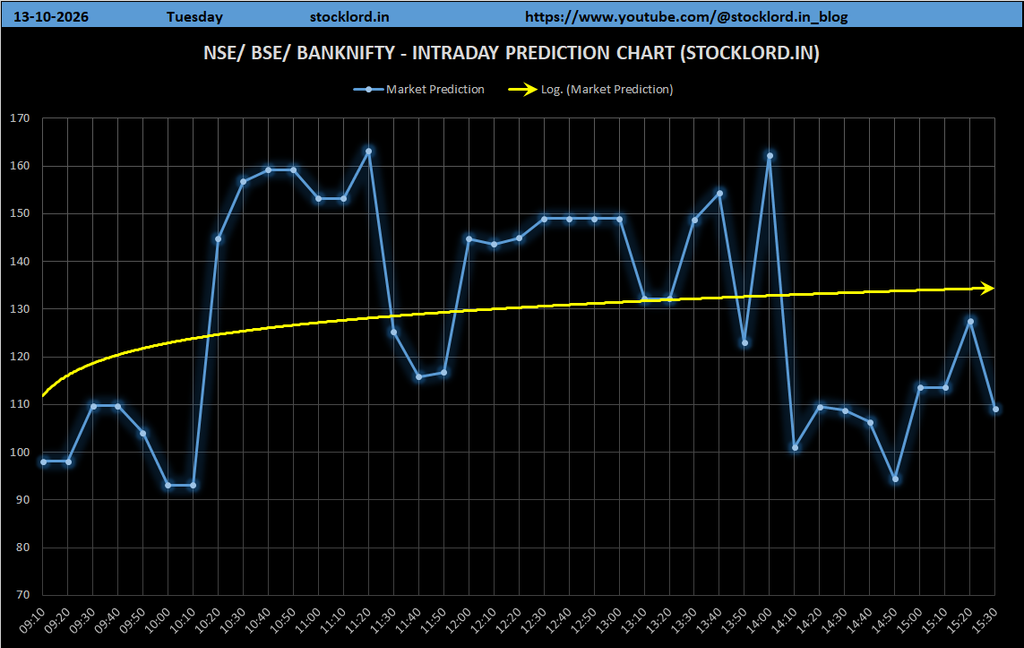
Tuesday, 13 October 2026: Possible Bearish Pressure Followed by Recovery
On Tuesday, the supplied analysis places the Moon and Mercury in Vishakha Nakshatra. The forecast suggests that the market could move below the previous day’s closing level.
The expected scenario includes initial weakness, followed by a possible recovery later in the session. The market may attempt to stabilize toward the end of the trading day.
Important reversal timings:
- 10:20 AM
- 12:10 PM
- 2:10 PM
What traders can watch: Pay attention to whether early selling continues or loses momentum. If NIFTY 50 recovers from lower levels, traders can monitor whether that recovery is sustained or fades near resistance.
Market bias: Initially bearish, with a possible recovery later in the session.
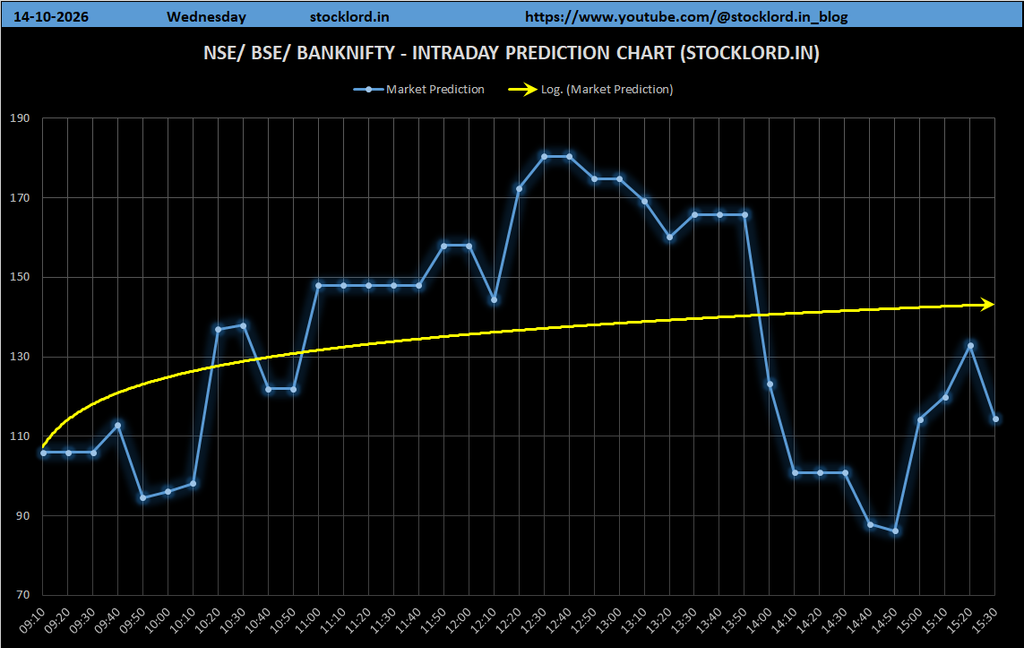
Wednesday, 14 October 2026: Potential Recovery and Upward Movement
Wednesday’s forecast suggests that the market may move upward after an initially bearish sentiment. NIFTY 50 could potentially trade above the previous day’s closing level.
The session may therefore be important for assessing whether early weakness develops into a stronger recovery.
Important reversal timings:
- 10:20 AM
- 12:10 PM
- 2:00 PM
- 2:45 PM
What traders can watch: Look for a sustained move above intraday resistance, supported by price momentum. If the index fails to hold a recovery, the bullish scenario may weaken.
Market bias: Potentially bullish after initial weakness.
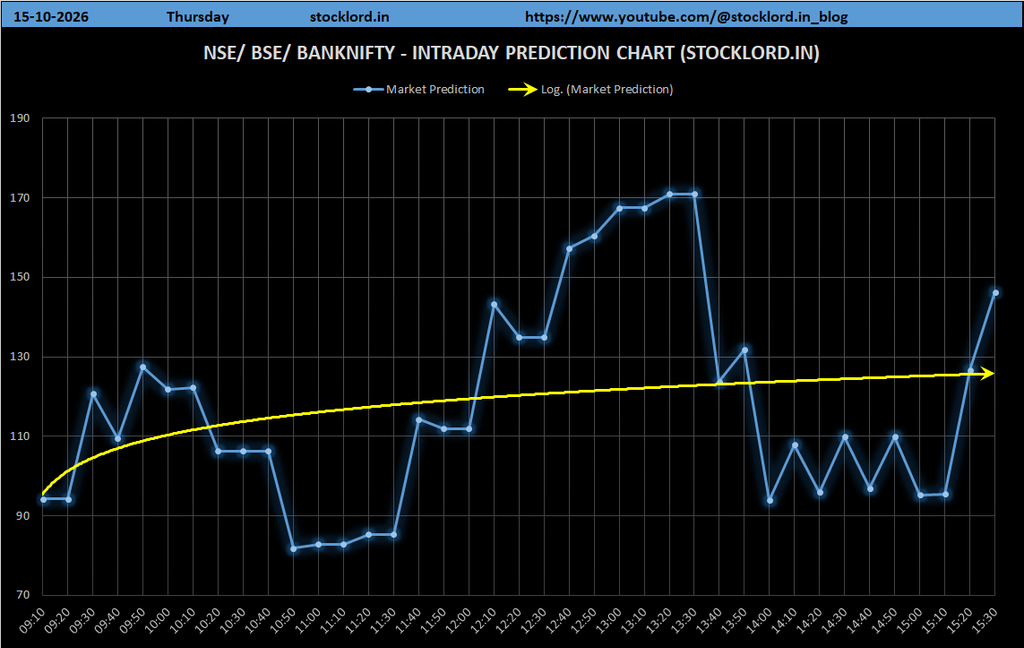
Thursday, 15 October 2026: Volatility and Two-Sided Market Swings
The supplied forecast expects NIFTY 50 to potentially move below the previous day’s closing level on Thursday. It also indicates that the market may swing in both directions.
This suggests a session in which intraday reversals could be more important than attempting to predict a single directional move from the opening.
Important reversal timings:
- 10:10 AM
- 10:45 AM
- 12:10 PM
- 2:00 PM
What traders can watch: Monitor whether the index breaks below support and continues lower or quickly recovers. Repeated moves across intraday levels may indicate unstable momentum.
Market bias: Potentially bearish, with two-sided volatility.
Friday, 16 October 2026: Possible Mid-Session Bounce
Friday’s forecast highlights the possibility of a sudden bounce during the middle part of the trading session.
The supplied timings identify several periods to monitor for a change in momentum. However, a bounce should not automatically be interpreted as a confirmed trend reversal.
Important reversal timings:
- 10:10 AM
- 12:00 PM
- 12:40 PM
- 1:25 PM
- 1:50 PM
What traders can watch: Look for evidence that buying pressure is strengthening, such as a sustained recovery from support and a successful move above nearby resistance. If price fails to hold the rebound, the move may be temporary.
Market bias: Potential mid-session recovery or bounce.
NIFTY 50 Support and Resistance Levels: 12–16 October 2026
The supplied data identifies the following NIFTY 50 intraday support and resistance levels for the week. These are reference zones for monitoring price behaviour; the source does not assign each level to a particular day or provide a separate directional trigger for every level.
NIFTY 50 intraday levels
| Intraday support | Intraday resistance |
|---|---|
| 22,490 | 22,550 |
| 22,430 | 22,610 |
| 22,340 | 22,700 |
| 22,220 | 22,820 |
| 22,040 | 23,000 |
| 21,770 | 23,270 |
| 21,470 | 23,570 |
| 21,110 | 23,930 |
| 20,660 | 24,380 |
| 20,180 | 24,860 |
| 19,640 | 25,400 |
NIFTY 50 weekly closing reference: 22,520
How to interpret NIFTY 50 levels
Support levels: The levels above the lower end of the supplied range can be monitored for potential buying interest or stabilization if the index declines. A support level is not guaranteed to hold.
Resistance levels: The listed resistance zones can be watched for potential selling pressure or a pause in an upward move. A sustained move above resistance may indicate strengthening momentum, while a rejection may indicate that sellers remain active.
Breakout and breakdown scenarios: A move beyond a level is more meaningful when confirmed by sustained price action. Traders should avoid treating a brief move through support or resistance as definitive evidence of a new trend.
The 22,520 weekly closing reference is a supplied benchmark, not a guaranteed closing target for 16 October.
BANKNIFTY Weekly Prediction: 12–16 October 2026
The supplied data provides a set of BANKNIFTY support and resistance levels and a weekly closing reference. It does not include a separate daily BANKNIFTY forecast for each trading session.
Consequently, the BANKNIFTY outlook should focus on the listed technical reference levels while using the NIFTY 50 daily scenarios as broader market context—not as proof that both indices will move in the same direction.
BANKNIFTY intraday support and resistance levels
| Intraday support | Intraday resistance |
|---|---|
| 55,226 | 55,286 |
| 55,166 | 55,346 |
| 55,076 | 55,436 |
| 54,956 | 55,556 |
| 54,776 | 55,736 |
| 54,506 | 56,006 |
| 54,206 | 56,306 |
| 53,846 | 56,666 |
| 53,396 | 57,116 |
| 52,916 | 57,596 |
| 52,376 | 58,136 |
| 51,746 | 58,766 |
| 51,086 | 59,426 |
| 50,366 | 60,146 |
| 49,556 | 60,956 |
| 48,716 | 61,796 |
| 47,816 | 62,696 |
BANKNIFTY weekly closing reference: 55,256
BANKNIFTY outlook and key levels to watch
The supplied BANKNIFTY levels provide a framework for monitoring intraday price movement during the week.
- Near-term reference zone: 55,226–55,286
- Lower support references: 55,166, 55,076 and 54,956
- Higher resistance references: 55,346, 55,436 and 55,556
- Weekly closing reference: 55,256
If BANKNIFTY sustains above nearby resistance, traders may watch the next listed resistance levels for potential continuation. If the index breaks below nearby support, the next lower levels may become relevant.
These are conditional scenarios only. The supplied data does not establish the probability of any level being reached or confirm a specific BANKNIFTY trend for each day.
Financial Astrology and Important Market Reversal Timings
Financial astrology attempts to interpret market behaviour using planetary positions, lunar movements and Nakshatra associations. In this week’s supplied analysis, particular attention is given to Swati and Vishakha Nakshatras and their relationship with the Moon, Mercury and Venus.
The forecast associates these configurations with possible changes in intraday market direction.
Weekly reversal timing calendar
| Date | Key timings to monitor | Forecast context |
|---|---|---|
| 12 October | 10:20 AM, 11:10 AM, 12:20 PM, 2:10 PM | Range-bound conditions and potential trend reversal |
| 13 October | 10:20 AM, 12:10 PM, 2:10 PM | Possible weakness followed by recovery |
| 14 October | 10:20 AM, 12:10 PM, 2:00 PM, 2:45 PM | Potential upward move after initial bearish sentiment |
| 15 October | 10:10 AM, 10:45 AM, 12:10 PM, 2:00 PM | Possible decline and two-sided swings |
| 16 October | 10:10 AM, 12:00 PM, 12:40 PM, 1:25 PM, 1:50 PM | Potential sudden bounce during the mid-session |
These timings are best treated as observation windows within the supplied astrology framework. They do not establish that a reversal will occur at a precise minute. Actual price behaviour may differ substantially.
Weekly Market Scenarios: Bullish or Bearish?
The supplied NIFTY 50 outlook points to a mixed week rather than a consistently bullish or bearish trend.
Potential bullish scenarios
- NIFTY 50 recovers on 14 October after initial bearish sentiment.
- The potential 16 October bounce develops into a sustained recovery.
- Price holds relevant support levels and moves above resistance with continued momentum.
- BANKNIFTY sustains above its nearby resistance references.
Potential bearish scenarios
- NIFTY 50 moves below the previous closing level on 13 October and selling pressure persists.
- The index declines on 15 October and fails to recover important support zones.
- Attempts to move higher are rejected near resistance.
- BANKNIFTY breaks below its nearby support references and continues lower.
Range-bound scenario
Monday’s forecast specifically allows for range-bound conditions. If the index repeatedly moves between support and resistance without sustained follow-through, traders may need to consider the possibility of consolidation rather than a clear directional trend.
No scenario should be considered confirmed solely because an astrology timing window has arrived. Price confirmation and risk management remain essential.
How Traders Can Use the Forecast
This weekly outlook can be used as a planning reference, rather than as a standalone trading system.
1. Mark the important levels before the session. Identify the relevant NIFTY 50 or BANKNIFTY support and resistance zones and monitor price behaviour around them.
2. Watch the listed time windows. Observe whether momentum changes near the supplied reversal timings, but do not assume that a reversal must occur.
3. Wait for price confirmation. Look for sustained movement, rejection, or a clear change in market structure before considering a directional trade.
4. Define risk before entering a position. Decide where the trade idea would be invalidated. Stops and position sizes should reflect volatility and individual risk limits.
5. Avoid overtrading. Several possible reversal timings in one session do not necessarily mean several reliable trading opportunities.
6. Treat NIFTY 50 and BANKNIFTY separately. The indices can diverge, so confirm the price behaviour of the instrument being traded.
7. Reassess when market conditions change. News, earnings, global cues, liquidity and unexpected events can outweigh any planned scenario.
Frequently Asked Questions (FAQs)
1. What is the NIFTY 50 prediction for 12–16 October 2026?
The supplied forecast describes a potentially range-bound session on 12 October, possible weakness followed by recovery on 13 October, an upward move after initial bearish sentiment on 14 October, two-sided swings on 15 October, and a possible mid-session bounce on 16 October.
These are speculative scenarios, not guaranteed predictions.
2. What is the BANKNIFTY prediction for the week?
The supplied data lists BANKNIFTY intraday support and resistance levels and a weekly closing reference of 55,256. It does not provide separate day-by-day BANKNIFTY directional predictions.
3. What is the NIFTY 50 weekly closing reference?
The supplied weekly closing reference for NIFTY 50 is 22,520. It should be treated as a reference value, not a confirmed future closing price.
4. What is the BANKNIFTY weekly closing reference?
The supplied weekly closing reference for BANKNIFTY is 55,256. Actual market performance may differ.
5. What are the important reversal timings for NIFTY 50 this week?
The supplied timings range from 10:10 AM to 2:45 PM, depending on the day. The complete date-wise schedule is included in the reversal timing calendar above.
6. Can financial astrology accurately predict stock market movements?
Financial astrology is speculative and lacks robust scientific evidence as a reliable standalone market-prediction method. Astrological timing should not be treated as proof that the market will reverse or move in a particular direction.
7. How should traders use the support and resistance levels?
Traders can monitor the listed levels for potential reactions, breakouts, breakdowns or consolidation. These levels should be assessed alongside live prices, volume, market conditions and an appropriate risk-management plan.
8. Is this weekly forecast suitable for intraday trading?
It can serve as a reference for planning observations during the trading session, but it is not a verified trading strategy. Intraday decisions require live data, confirmation and predefined risk limits.
Conclusion: NIFTY 50 and BANKNIFTY Outlook for 12–16 October 2026
The supplied financial astrology forecast suggests a mixed week for NIFTY 50, with potential trend reversals, early-session weakness, recovery attempts, two-sided swings and a possible bounce on Friday.
The most important reference values are 22,520 for NIFTY 50 and 55,256 for BANKNIFTY, alongside the full set of intraday support and resistance levels provided in this article.
For traders following financial astrology, the listed reversal timings offer windows to observe market behaviour. However, the direction of the market and the reliability of any trading opportunity must be assessed using actual price action and current conditions.
Use this forecast as an informational planning resource, apply disciplined risk management, and avoid making trading decisions based on astrology alone.
