
The final week of August 2026 is expected to be an active and highly dynamic trading week for NIFTY 50 and BANK NIFTY, with a mixture of bullish opportunities, intraday volatility and possible late-session reversals.
According to the supplied financial-astrology framework, the week contains several important planetary configurations, including a bullish Moon D9 conjunction, Moon’s conjunction with Pluto in Abhijit Nakshatra, a Sun–Ketu–Rahu Vedha according to Sarvato Bhadra Chakra (SBC), and a bearish D9 influence involving Neptune and Rahu.
The overall weekly structure does not indicate a simple one-directional market. Instead, the analysis points toward frequent changes in intraday sentiment, with several sessions potentially moving from weakness to strength or from a rally into profit booking.
For traders, the combination of reversal timings and predefined NIFTY 50/BANK NIFTY levels will therefore be particularly important.
Overall weekly theme: Volatility with opportunities for bullish recovery, but traders should remain alert for sudden reversals.
Key Highlights for 24–28 August 2026
- Monday may start volatile but could see a recovery during the middle of the session.
- Tuesday carries a comparatively bullish bias because of the bullish Moon D9 conjunction.
- Wednesday may also favor the bulls under the Sun–Ketu–Rahu Vedha configuration.
- Thursday could begin with two-way volatility before a recovery after 11:00 AM.
- Friday may see a bounce followed by renewed selling after approximately 1:30 PM.
- 11:30 AM, 1:40 PM and 2:45 PM emerge as recurring reversal windows on several days.
- NIFTY 50’s supplied weekly closing reference is 24,252.
- BANK NIFTY’s supplied weekly closing reference is 57,762.
Daily NIFTY 50 & BANK NIFTY Prediction
Monday, 24 August 2026
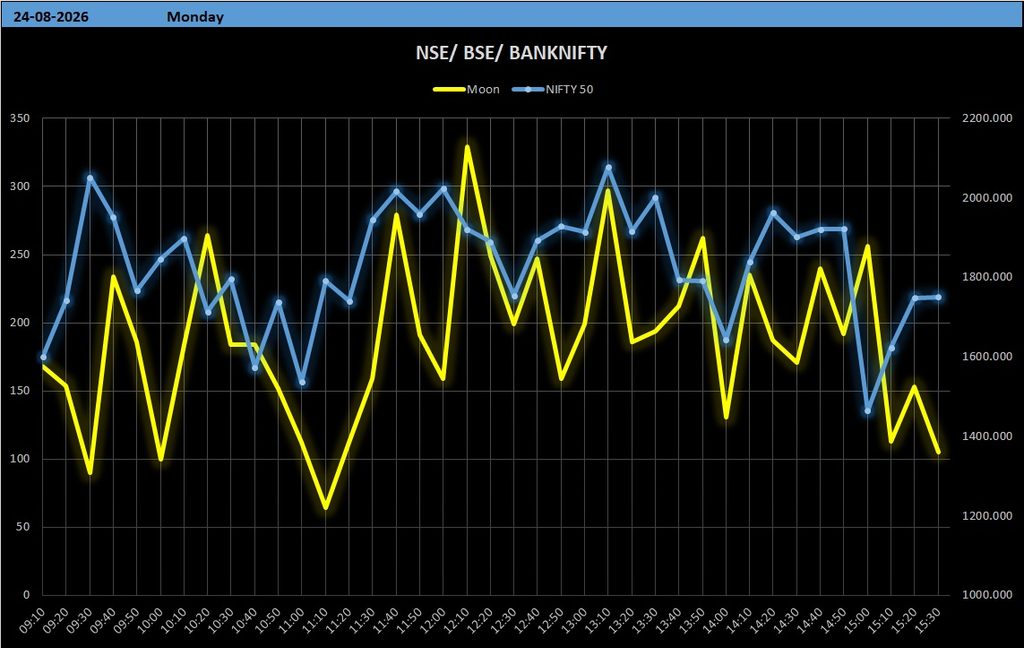
The week may begin with a volatile trading session. The opening phase could experience uncertainty and rapid changes in direction. However, the market may develop buying interest during the middle portion of the session.
This suggests that an initially weak or unstable market should not automatically be interpreted as a continuation of the downside trend.
A recovery may develop as the session progresses, although another reversal later in the day cannot be ruled out.
Market Bias: Volatile with Potential Mid-Session Recovery
Important reversal timings:
- 9:20 AM
- 11:30 AM
- 1:40 PM
- 2:45 PM
Trading Outlook
Monday could be a day for confirmation-based trading rather than aggressive directional positioning. If the market establishes support during the morning and then starts making higher highs and higher lows, the anticipated mid-session recovery could gain strength.
On the other hand, failure to hold important support levels may keep volatility elevated.
Tuesday, 25 August 2026
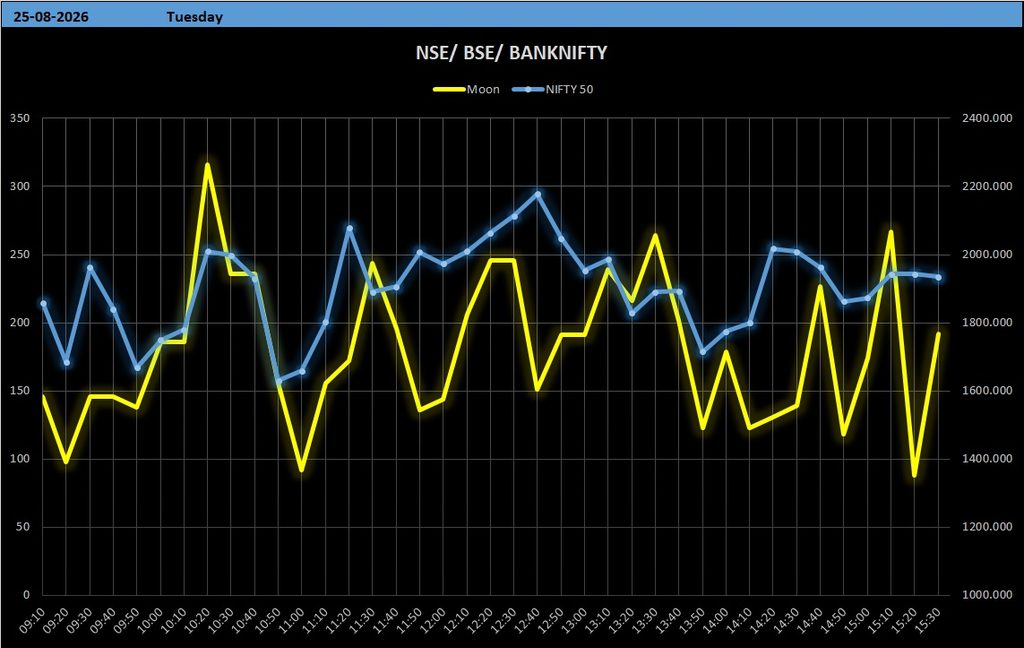
Tuesday presents a more constructive setup.
The Moon is associated with a bullish D9 conjunction, while the conjunction with Pluto in Abhijit Nakshatra is considered significant within the methodology used for this forecast.
These factors may support a more positive market sentiment and could encourage buying interest.
Market Bias: Bullish
Important reversal timings:
- 11:30 AM
- 1:40 PM
- 2:45 PM
Trading Outlook
Tuesday may offer better opportunities for traders looking for bullish momentum, particularly if NIFTY 50 and BANK NIFTY remain above their important intraday support zones.
However, even during a bullish session, the specified reversal windows should be monitored for temporary corrections or changes in momentum.
A sustained move above the first resistance zone could potentially open the way toward higher resistance levels.
Wednesday, 26 August 2026
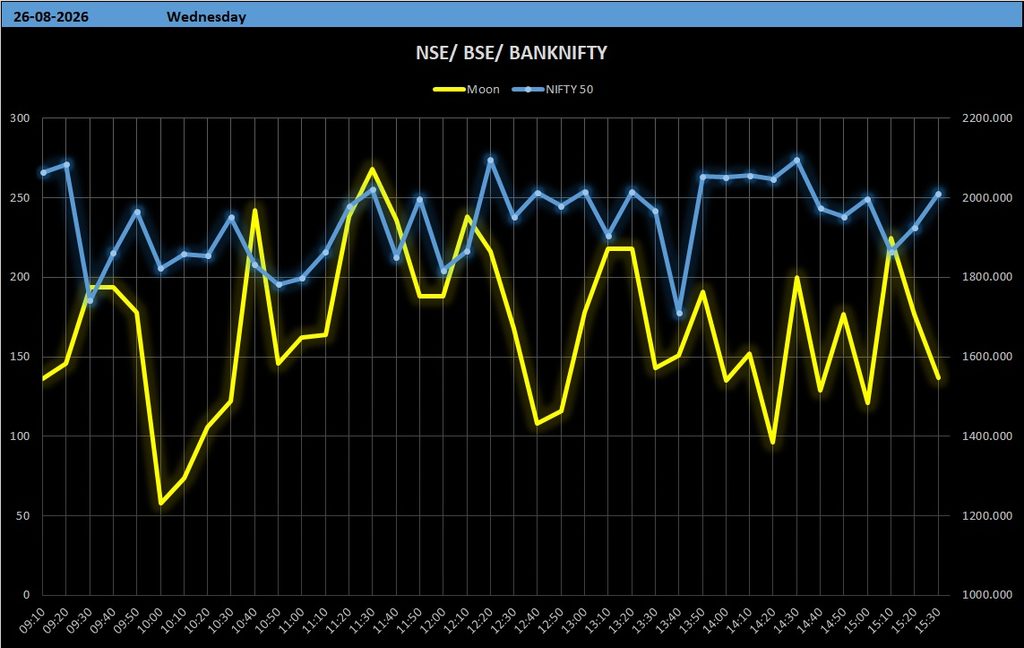
Wednesday is another potentially important session.
The Sun–Ketu–Rahu Vedha, according to the Sarvato Bhadra Chakra framework, may create a bullish influence for the day.
This could result in stronger buying sentiment, although such configurations can also produce unusual or sudden price movements.
Market Bias: Bullish with Volatility
Important reversal timings:
- 11:30 AM
- 1:40 PM
- 2:45 PM
Trading Outlook
Wednesday could extend the positive sentiment seen on Tuesday.
Traders should nevertheless watch whether the market is able to sustain its gains rather than merely producing a short-lived spike.
If NIFTY 50 and BANK NIFTY move above their initial resistance levels and successfully hold those breakouts, the next resistance zones could become relevant.
Thursday, 27 August 2026
Thursday brings a more complicated astrological setup.
The Moon is expected to form a bearish D9 conjunction with Neptune, while simultaneously being in the same Nakshatra as Rahu. This combination suggests the possibility of two-way market movement.
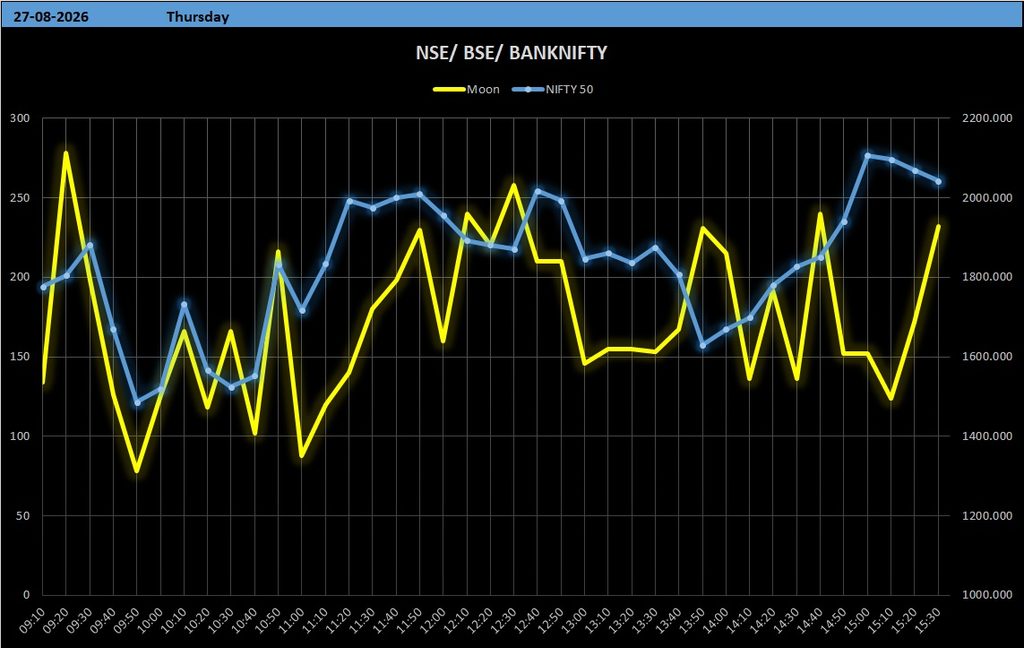
The market could initially remain uncertain or weak, but the analysis indicates that after 11:00 AM the market may attempt an upward move.
Market Bias: Mixed, With Potential Recovery After 11:00 AM
Important reversal timings:
- 9:20 AM
- 11:30 AM
- 1:40 PM
- 2:45 PM
Trading Outlook
Thursday could be particularly challenging for traders because the morning direction may not necessarily represent the entire day’s trend.
An early decline followed by a recovery after 11:00 AM would fit the projected scenario.
Therefore, traders should avoid overcommitting to the first directional move and instead monitor price action around the reversal windows.
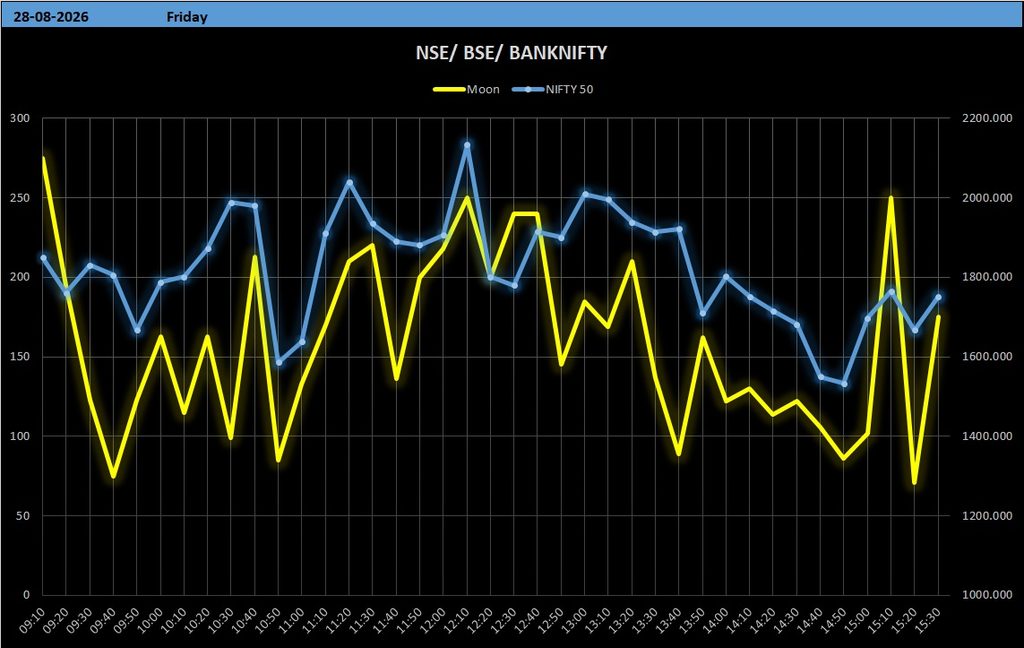
Friday, 28 August 2026
Friday could begin with substantial volatility.
The morning session, particularly until approximately 11:00 AM, may see rapid fluctuations. After that, a bounce is possible.
However, the outlook becomes more cautious after approximately 1:30 PM, when another round of selling or profit booking may emerge.
Market Bias: Volatile, Bounce Possible, Then Sell-Off Risk
Important reversal timings:
- 11:30 AM
- 1:40 PM
- 2:45 PM
Trading Outlook
Friday could produce a classic bounce-and-sell-off pattern.
If the market rallies during the first half of the session, traders should closely monitor whether the rally can sustain above resistance. Failure to maintain higher levels after 1:30 PM could result in profit booking.
The closing phase therefore deserves special attention.
NIFTY 50 Weekly Support & Resistance Levels
The supplied NIFTY 50 levels provide a broad trading map for the week.
NIFTY 50 Intraday Support
| Support | Level |
|---|---|
| S1 | 24,222 |
| S2 | 24,162 |
| S3 | 24,072 |
| S4 | 23,952 |
| S5 | 23,772 |
| S6 | 23,502 |
| S7 | 23,202 |
| S8 | 22,842 |
| S9 | 22,392 |
| S10 | 21,912 |
| S11 | 21,372 |
NIFTY 50 Intraday Resistance
| Resistance | Level |
|---|---|
| R1 | 24,282 |
| R2 | 24,342 |
| R3 | 24,432 |
| R4 | 24,552 |
| R5 | 24,732 |
| R6 | 25,002 |
| R7 | 25,302 |
| R8 | 25,662 |
| R9 | 26,112 |
| R10 | 26,592 |
| R11 | 27,132 |
NIFTY 50 Weekly Closing Reference
24,252
NIFTY 50 Interpretation
The immediate NIFTY 50 decision zone is around 24,222–24,282.
A sustained move above 24,282 could strengthen the bullish scenario and bring the next resistance levels into focus.
Conversely, a decisive break below 24,222 could increase selling pressure and expose the lower support structure.
The levels should be treated as reference zones rather than guaranteed reversal points.
BANK NIFTY Weekly Support & Resistance Levels
BANK NIFTY remains particularly important for this week’s outlook because of the potential for sharp sector-specific moves.
BANK NIFTY Intraday Support
| Support | Level |
|---|---|
| S1 | 57,732 |
| S2 | 57,672 |
| S3 | 57,582 |
| S4 | 57,462 |
| S5 | 57,282 |
| S6 | 57,012 |
| S7 | 56,712 |
| S8 | 56,352 |
| S9 | 55,902 |
| S10 | 55,422 |
| S11 | 54,882 |
| S12 | 54,252 |
| S13 | 53,592 |
| S14 | 52,872 |
| S15 | 52,062 |
| S16 | 51,222 |
| S17 | 50,322 |
BANK NIFTY Intraday Resistance
| Resistance | Level |
|---|---|
| R1 | 57,792 |
| R2 | 57,852 |
| R3 | 57,942 |
| R4 | 58,062 |
| R5 | 58,242 |
| R6 | 58,512 |
| R7 | 58,812 |
| R8 | 59,172 |
| R9 | 59,622 |
| R10 | 60,102 |
| R11 | 60,642 |
| R12 | 61,272 |
| R13 | 61,932 |
| R14 | 62,652 |
| R15 | 63,462 |
| R16 | 64,302 |
| R17 | 65,202 |
BANK NIFTY Weekly Closing Reference
57,762
BANK NIFTY Interpretation
The first major decision area is around 57,732–57,792.
If BANK NIFTY sustains above 57,792, the market may attempt to move toward 57,852, 57,942 and 58,062.
A sustained breakdown below 57,732, however, could expose the next support levels at 57,672, 57,582 and 57,462.
Given the expected volatility, traders should pay particular attention to failed breakouts and breakdowns around these levels.
NIFTY 50 vs BANK NIFTY: Which Could Perform Better?
The weekly setup suggests that both indices could experience meaningful movement, but their behavior may differ from session to session.
NIFTY 50
NIFTY 50 may experience:
- Volatility at the beginning of the week
- Improved sentiment on Tuesday and Wednesday
- Two-way movement on Thursday
- A potential bounce followed by selling on Friday
BANK NIFTY
BANK NIFTY could show strong intraday momentum if the bullish planetary configurations translate into increased market participation.
The key area to monitor remains 57,732–57,792. A sustained breakout from this zone could indicate strengthening bullish momentum, while a breakdown could trigger a move toward lower support levels.
Weekly Reversal Timing Map
For traders who follow the supplied financial-astrology methodology, the following windows are particularly important:
| Date | Reversal Windows |
|---|---|
| 24 Aug | 9:20 AM, 11:30 AM, 1:40 PM, 2:45 PM |
| 25 Aug | 11:30 AM, 1:40 PM, 2:45 PM |
| 26 Aug | 11:30 AM, 1:40 PM, 2:45 PM |
| 27 Aug | 9:20 AM, 11:30 AM, 1:40 PM, 2:45 PM |
| 28 Aug | 11:30 AM, 1:40 PM, 2:45 PM |
An interesting feature is the repeated appearance of 11:30 AM, 1:40 PM and 2:45 PM. These can be treated as windows in which traders should watch for a change in momentum.
However, a timing window alone should not be used as a trading signal. Price action and the relevant support/resistance level should confirm the reversal.
Weekly Market Scenarios
Bullish Scenario
The bullish scenario becomes stronger if NIFTY 50 and BANK NIFTY:
- Hold their initial support zones.
- Sustain above their first resistance levels.
- Show higher highs and higher lows after the anticipated reversal windows.
- Maintain momentum during the second half of the session.
Under such conditions, the higher resistance levels supplied in the weekly framework may become the next targets.
Bearish Scenario
The bearish scenario becomes stronger if:
- Initial support levels fail decisively.
- Breakdowns are accompanied by sustained selling.
- Attempts to recover are rejected near resistance.
- Friday’s potential afternoon sell-off develops after a weak or overextended rally.
In that situation, traders should monitor successive support levels rather than assuming that the first support will hold.
Volatile/Range-Bound Scenario
This may be the most important scenario for the week.
The astrological setup contains both bullish and bearish influences. Therefore, the market may repeatedly move between support and resistance without developing a sustained trend.
In such a market, overtrading can become a bigger risk than missing a trade.
What Traders Should Watch This Week
1. The 24,222–24,282 NIFTY Zone
This is an important immediate decision area based on the supplied levels.
2. The 57,732–57,792 BANK NIFTY Zone
This is the comparable immediate decision zone for Bank Nifty.
3. Tuesday and Wednesday
These sessions carry the stronger bullish indications in the supplied astrological framework.
4. Thursday Morning
The morning may be volatile, with a potential recovery after 11:00 AM.
5. Friday Afternoon
The potential sell-off after 1:30 PM makes the closing phase particularly important.
6. Repeated 11:30 AM / 1:40 PM / 2:45 PM Windows
These recurring timings should be monitored for potential momentum shifts.
Final NIFTY 50 & BANK NIFTY Weekly Prediction
The 24–28 August 2026 market outlook points toward a volatile but potentially constructive week, particularly during the middle portion of the week.
Monday may begin with uncertainty before a possible mid-session recovery. Tuesday and Wednesday carry the strongest bullish indications, based on the supplied D9 and Sarvato Bhadra Chakra interpretations.
Thursday is likely to remain a two-way market, with a possible recovery after 11:00 AM despite the bearish D9 influence. Friday may produce a bounce during the session but carries a renewed sell-off risk after approximately 1:30 PM.
From a technical perspective, the immediate zones to watch are:
- NIFTY 50: 24,222 support / 24,282 resistance
- BANK NIFTY: 57,732 support / 57,792 resistance
The supplied weekly closing references are 24,252 for NIFTY 50 and 57,762 for BANK NIFTY.
Overall, the week’s theme can be summarized as:
“Volatility at the start, bullish potential in the middle, and renewed reversal risk toward the end.”
Traders following this methodology should combine the astrological timing windows with price action, support/resistance, volume and risk management rather than treating any single indicator as a standalone signal.
Frequently Asked Questions
What is the NIFTY 50 prediction for 24–28 August 2026?
The supplied analysis suggests a volatile week with bullish potential particularly on 25 and 26 August, while Monday and Thursday may see greater two-way movement. Friday carries a possibility of an afternoon sell-off.
What is the Bank Nifty prediction for 24–28 August 2026?
Bank Nifty is expected to remain volatile, with the possibility of stronger bullish momentum during the middle of the week. The 57,732–57,792 area is an important immediate support/resistance zone in the supplied levels.
What are the important NIFTY 50 levels this week?
The immediate supplied levels are 24,222 support and 24,282 resistance, followed by progressively lower support and higher resistance levels.
What are the important Bank Nifty levels?
The immediate supplied levels are 57,732 support and 57,792 resistance.
Which days look bullish?
According to the supplied financial-astrology analysis, 25 August and 26 August have the stronger bullish bias.
Is Friday bearish?
Friday is described as volatile, with a possible bounce followed by renewed selling after approximately 1:30 PM. This is a forecast scenario, not a certainty.
Disclaimer
This article is based on the financial astrology, D9 conjunctions, Sarvato Bhadra Chakra interpretations, reversal timings and technical levels supplied for this analysis. Astrological market analysis is interpretive and does not guarantee future price movements.
The support, resistance and reversal timings are reference points, not guaranteed trading signals. Financial markets involve substantial risk. This content is intended for educational and informational purposes only and should not be considered investment advice or a recommendation to buy or sell any security. Always conduct independent research, use appropriate risk management and consult a qualified financial professional where appropriate.
