
The upcoming trading week may remain highly volatile, as several important astrological combinations are forming in the planetary charts. According to the D-9 planetary analysis, the market may witness alternating bullish and bearish sentiments throughout the week, creating multiple intraday opportunities for traders.
One of the most significant astrological events during this period is the transit of Mars into Pisces on 2 April 2026. Historically, Mars transit often results in Gap-Up or Gap-Down openings in the market due to sudden momentum changes. Traders should therefore remain cautious around this date as volatility may increase significantly.
Overall, the week may provide strong intraday movements, sudden reversals, and temporary trend shifts, making it suitable for active traders who follow time-based market analysis.
Daily Market Sentiment & Reversal Time
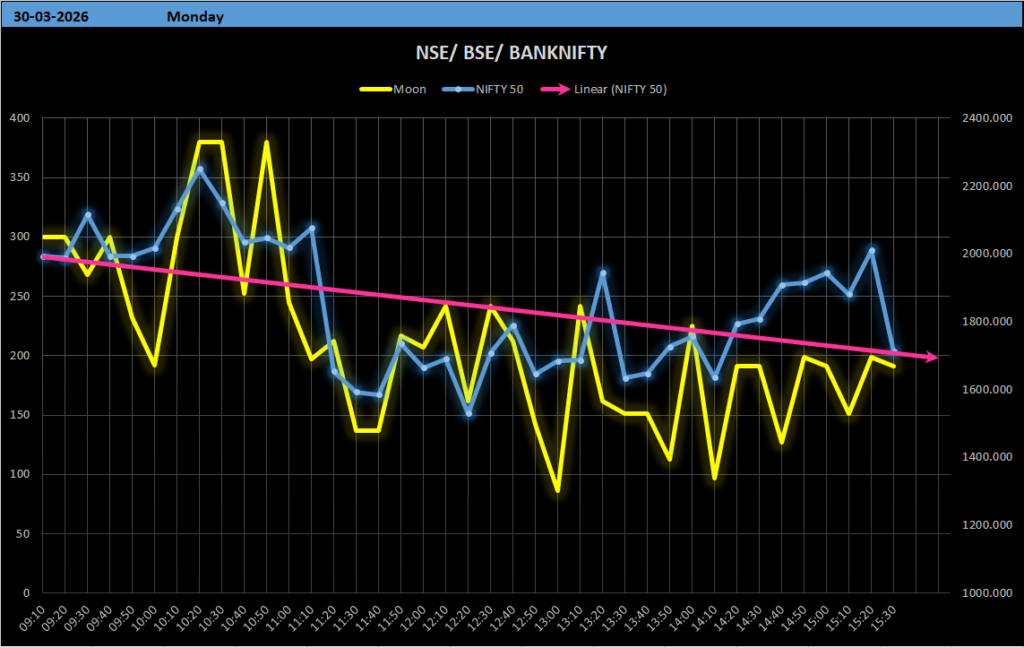
30 March 2026
The D-9 chart indicates a bearish planetary conjunction, suggesting a slightly negative market sentiment. However, the market may remain volatile during the middle session.
Reversal Time:
11:20 AM, 01:30 PM, 02:45 PM
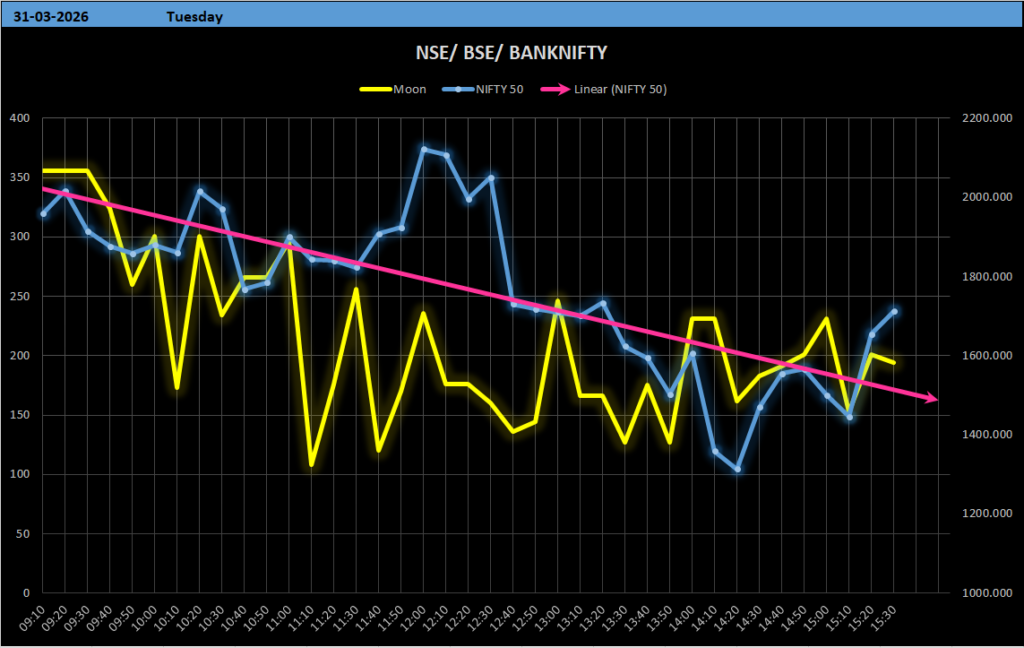
31 March 2026
A bullish conjunction in the D-9 chart may support upward movement in the market. Buying interest may appear during key reversal windows.
Reversal Time:
11:20 AM, 01:30 PM, 02:40 PM, 03:20 PM
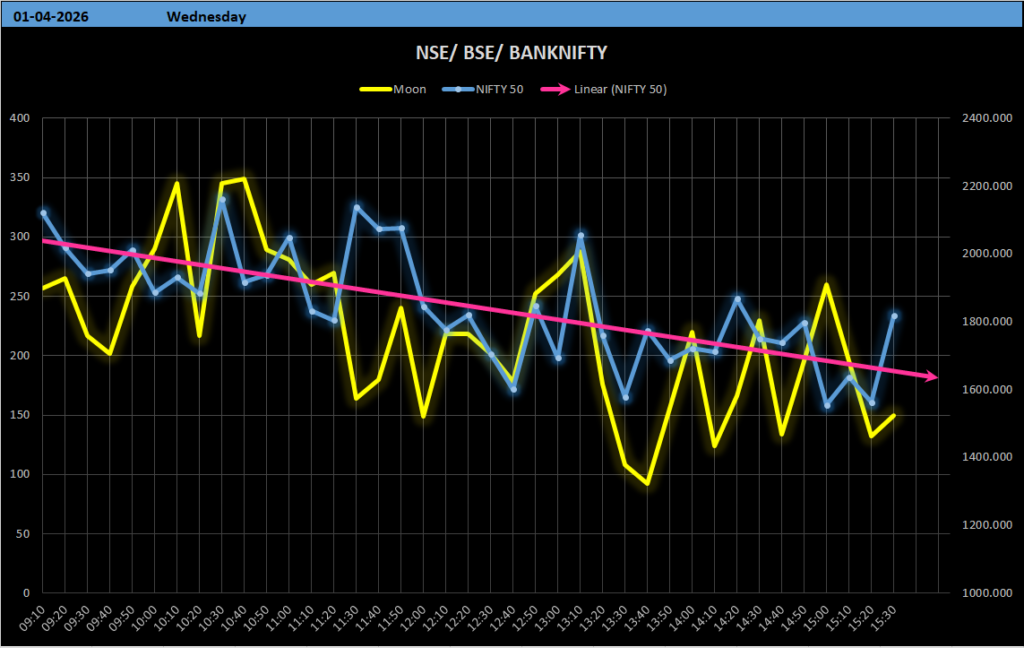
1 April 2026
This day may experience high volatility with temporary bounce opportunities. Both bullish and bearish forces may dominate the market at different times.
Reversal Time:
10:00 AM, 11:10 AM, 01:20 PM
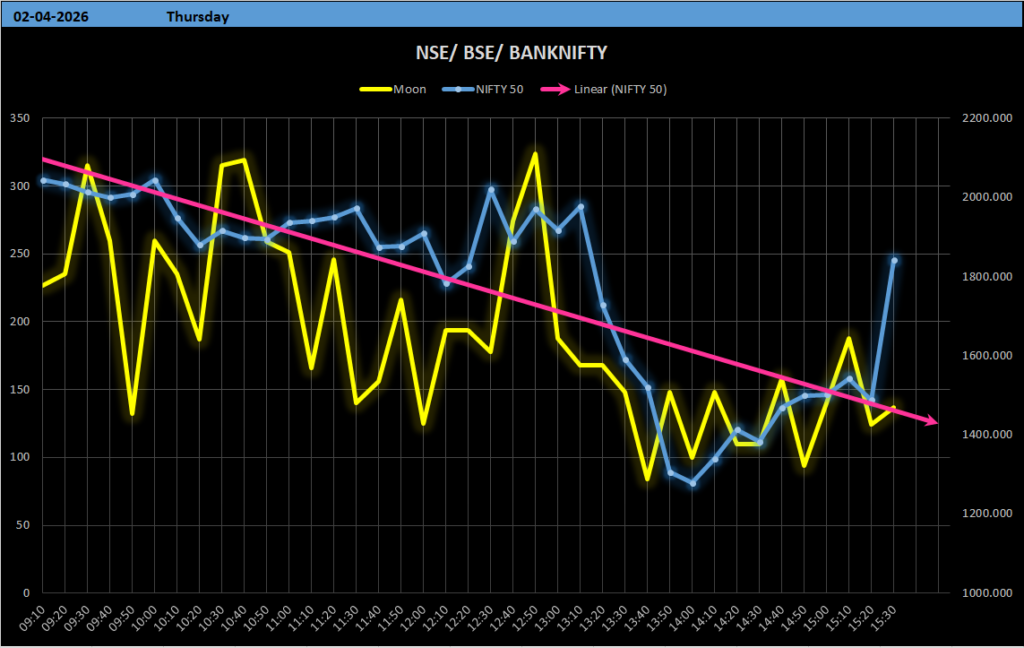
2 April 2026
Market sentiment may turn bearish, and the transit of Mars may trigger a gap opening along with sudden price swings.
Reversal Time:
11:10 AM, 01:20 PM, 02:10 PM
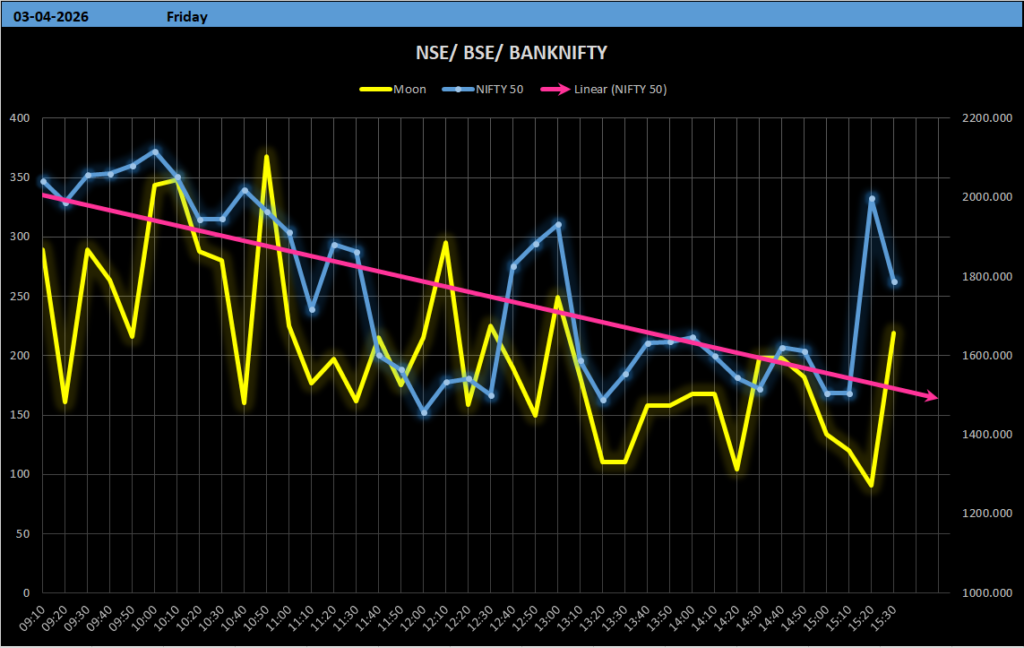
3 April 2026
Planetary combinations suggest strong chances of bullish momentum in the first half and selling pressure and bearish market in the 2nd half.
Reversal Time:
11:10 AM, 01:10 PM, 03:20 PM
NIFTY 50 Key Levels (30 Mar – 3 Apr 2026)
Intraday Support Levels:
22789 – 22729 – 22639 – 22519 – 22339 – 22069 – 21769 – 21409 – 20959 – 20479 – 19939
Intraday Resistance Levels:
22849 – 22909 – 22999 – 23119 – 23299 – 23569 – 23869 – 24229 – 24679 – 25159 – 25699
Weekly Closing Level:
22819
BANK NIFTY Key Levels (30 Mar – 3 Apr 2026)
Intraday Support Levels:
52244 – 52184 – 52094 – 51974 – 51794 – 51524 – 51224 – 50864 – 50414 – 49934 – 49394
Intraday Resistance Levels:
52304 – 52364 – 52454 – 52574 – 52754 – 53024 – 53324 – 53684 – 54134 – 54614 – 55154
Weekly Closing Level:
52274
Additional major levels to watch if extreme volatility appears:
48104 – 47384 – 46574 – 45734 – 44834 (Supports)
55784 – 56444 – 57164 – 57974 – 58814 – 59714 (Resistances)
Trading Strategy for the Week
Traders should focus on time-based reversals and volatility spikes rather than holding strong directional bias throughout the week. The market may frequently change direction near the predicted reversal windows.
Key observations for the week:
- Expect volatile mid-session movements.
- Mars transit on 2 April may cause sudden gap openings.
- The market may remain mixed to bearish early in the week, while bullish momentum may appear near the end of the week.
- Intraday traders should watch support and resistance levels carefully to identify breakout or reversal opportunities.