The Gann Square of 9 is one of the most intriguing and powerful tools developed by the legendary trader W.D. Gann. As a dedicated student of Gann’s theories, I have been using a 35×35 Square of 9 grid, which I’ve applied to predict many major reversal dates in previous posts. My fascination with the Square of 9 grows deeper every day as I discover new layers of accuracy. It works beyond what I have comprehended so far, and I continue to study and refine my understanding of it.
The Square of 9 is a tool that connects time and price in a spiral pattern, revealing important support, resistance, and turning points. It has applications across markets, including stocks, commodities, and indices. This article delves into the secrets of the Gann Square of 9, its natural number system, and how to calculate pressure dates from this tool.
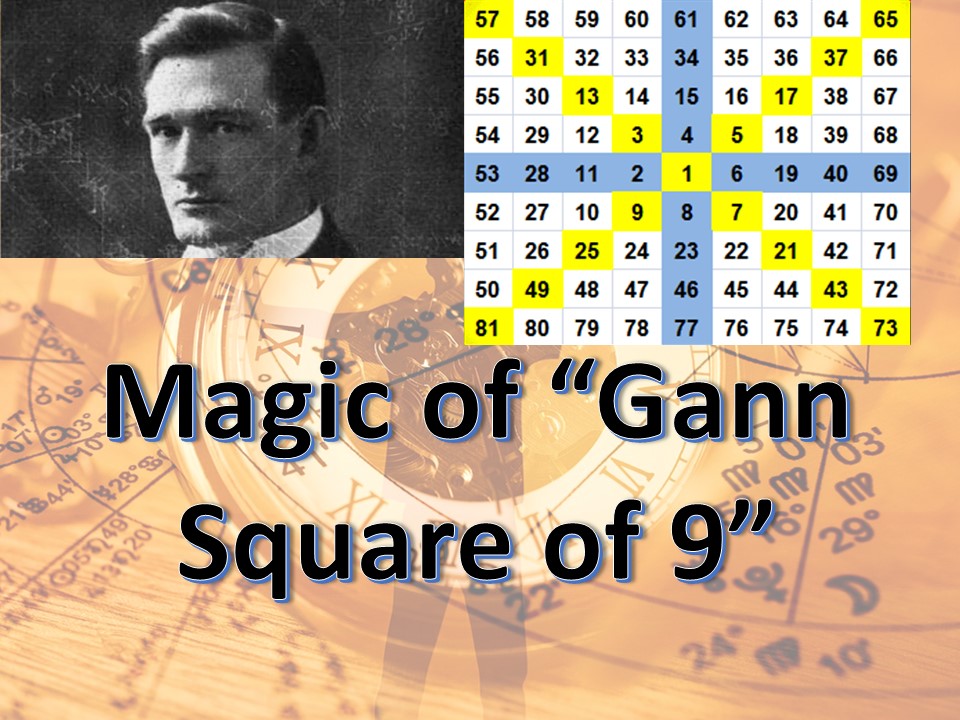
What is the Gann Square of 9?
The Gann Square of 9 is a mathematical spiral or grid that starts from the number 1 at the center and spirals outward in a clockwise direction. Each number is arranged in such a way that key angles (such as 45°, 90°, 180°, and 360°) hold significant importance in determining support, resistance, and turning points in the market.
W.D. Gann believed that markets move in predictable patterns, and by using the natural numbers in the Gann Square of 9, traders can anticipate price movements and time-based market reversals.
Key Features of the Gann Square of 9:
- Spiral Design: Starts from the center and moves outward in a square spiral.
- Angles and Degrees: Important price and time levels align with specific angles.
- 360° Cycle: A complete revolution around the center corresponds to significant market movements.
How the Natural Numbers of the Gann Square of 9 Work in Any Market
The natural numbers within the Gann Square of 9 hold immense significance. Here’s how they work:
- Support and Resistance Levels:
- Numbers that align at 90°, 180°, 270°, and 360° from a reference point often act as key support or resistance levels.
- For example, if a stock is trading at 100, numbers located at 90° increments may act as potential turning points.
- Price Projections:
- Traders can use the square to project future price targets. By moving outward along the spiral, they can identify levels where prices may pause or reverse.
- Market Cycles:
- The Gann Square of 9 helps identify cyclical turning points based on time and price relationships.
Application in Different Markets:
- Stocks: Used to identify key support and resistance levels, as well as potential reversal dates.
- Commodities: Helps in projecting future price levels and market tops or bottoms.
- Indices: Used to analyze overall market trends and predict significant turning points.
What is the Square of 9 Dates?
The Square of 9 dates refers to the calculation of specific time-based turning points in the market. W.D. Gann believed that time and price are intricately related, and by using the Square of 9, traders can predict when a market is likely to reverse.
How to Calculate Square of 9 Dates:
- Identify a Key Date: Start by selecting a significant past date (such as a major market high or low).
- Move Outward in the Spiral: Move outward along the spiral in specific angular increments (e.g., 90°, 180°, or 360°) to determine potential future turning points.
- Mark Important Dates: Dates that align with these angles are considered potential pressure or reversal dates.
Example:
- If a market made a significant bottom on January 1, moving 90° or 180° along the Square of 9 may identify potential reversal dates in the future.
What is the Secret of Gann?
The secret of W.D. Gann lies in his deep understanding of the relationship between time, price, and natural geometric patterns. Here are some of the key principles behind his methods:
- Mathematical Symmetry: Gann believed that markets move in symmetrical patterns, and by using tools like the Square of 9, traders can predict future price movements.
- Geometric Angles: Specific angles (e.g., 45°, 90°, 180°) are critical in determining support, resistance, and reversal points.
- Time and Price Equivalence: Gann emphasized the concept that time and price are equal. For example, a 90° move in time should correspond to a 90° move in price.
- Pressure Dates: Gann’s methods also focus on identifying key dates when the market is likely to experience significant pressure or reversals.
What is the Perfect Square of 9?
The term “perfect square of 9” refers to numbers that are perfectly aligned along the 360° cycle within the Square of 9. These numbers often hold special significance in the market:
- Perfect Squares: Numbers like 9, 16, 25, 36, etc., are perfect squares and often mark significant support or resistance levels.
- Angular Relationships: Numbers aligned at 45°, 90°, 180°, and 360° angles from perfect squares are considered critical price levels.
Using Perfect Squares in Trading:
- Perfect squares can be used as reference points to identify future price targets.
- Traders often use these levels to set stop-losses or profit targets.

Here in the above image, I have shown a simple square of 9 (9X9). The values at diagonal and perpendicular or horizontal crossing lines act as very good support and resistance. To show them I have drawn the line levels at the stock price chart of Bank of Maharashtra.
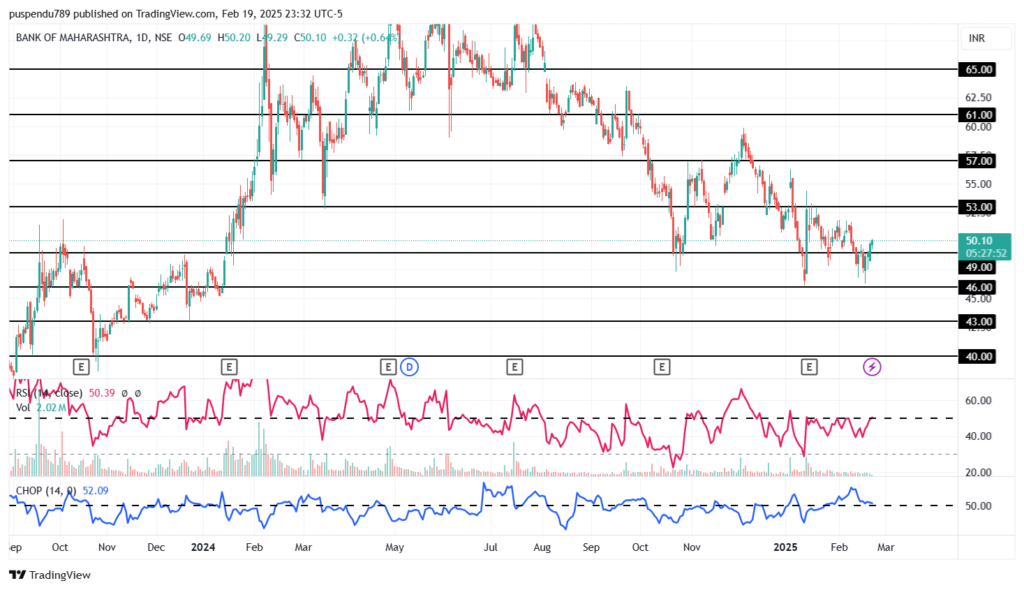
See these natural numbers act how beautifully. Stock prices always take support or resistance near these lines.
Calculating Pressure Dates from the Square of 9
One of the most valuable applications of the Gann Square of 9 is identifying pressure dates—days when the market is likely to experience significant volatility or trend reversals.
How to Calculate Pressure Dates:
- Select a Major Pressure Date: Choose a significant historical date (e.g., a major market high or low).
- Place the Date at the Center: Position this date at the center of the Square of 9.
- Move Outward Along the Spiral: Move outward in angular increments (e.g., 45°, 90°, 180°, or 360°) to identify future pressure dates.
- Mark These Dates: Dates aligned with these angles are potential reversal points.
Example:
- If a major market bottom occurred on January 1, moving 90° outward from this date may highlight potential future reversal dates, such as April 1 or July 1.
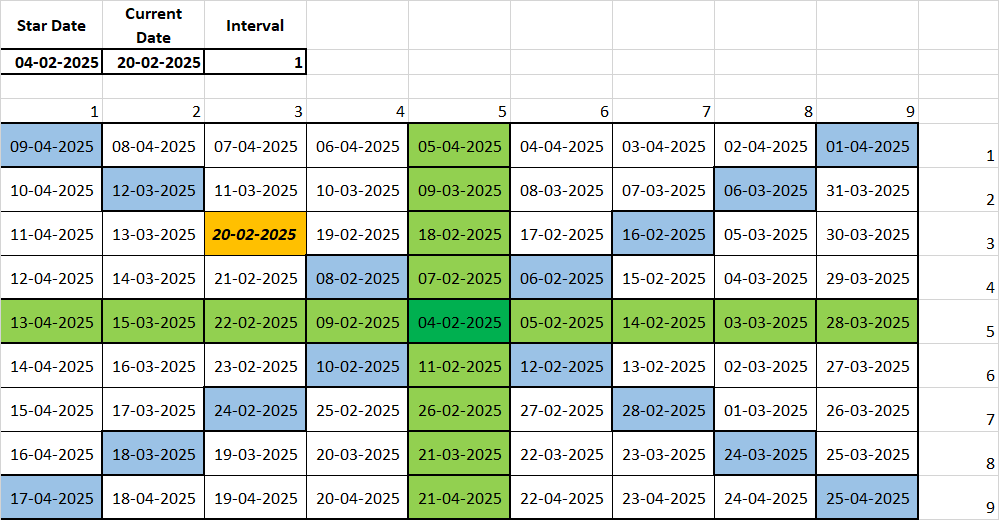
Calculating upcoming Gann Pressure dates where the Market may take reversal, or shall make important tops or bottoms is very easy with the square of 9.
Practical Application in Trading
To use the Gann Square of 9 effectively, traders should:
- Identify Key Reference Points: Start with a significant price or date.
- Use Angular Relationships: Focus on numbers aligned at 45°, 90°, 180°, and 360° angles.
- Combine with Other Indicators: Use the Square of 9 in conjunction with other technical indicators like RSI, MACD, or Moving Averages for more accurate predictions.
- Monitor Pressure Dates: Pay close attention to pressure dates to anticipate potential market reversals.
Conclusion
The Gann Square of 9 is a powerful tool that can help traders predict market trends, price levels, and reversal dates. By understanding the natural numbers, angular relationships, and pressure dates within the Square of 9, traders can make more informed decisions across various markets, including stocks, commodities, and indices.
Whether you’re a novice trader or an experienced analyst, mastering the secrets of the Gann Square of 9 can provide a significant edge in the market. Keep experimenting, and stay tuned to Stocklord.in for more insights on Gann theories and advanced trading strategies!
We have created a downloadable Square of 9 (35×35) Excel sheet for both price and date calculations, designed to help traders easily apply Gann’s methods. This sheet allows you to input key dates or prices and instantly calculate potential reversal points or pressure dates based on the angular relationships within the Square of 9. Download it now to enhance your market analysis and trading strategies!
3 thoughts on “Comprehensive Guide to the Gann Square of 9”