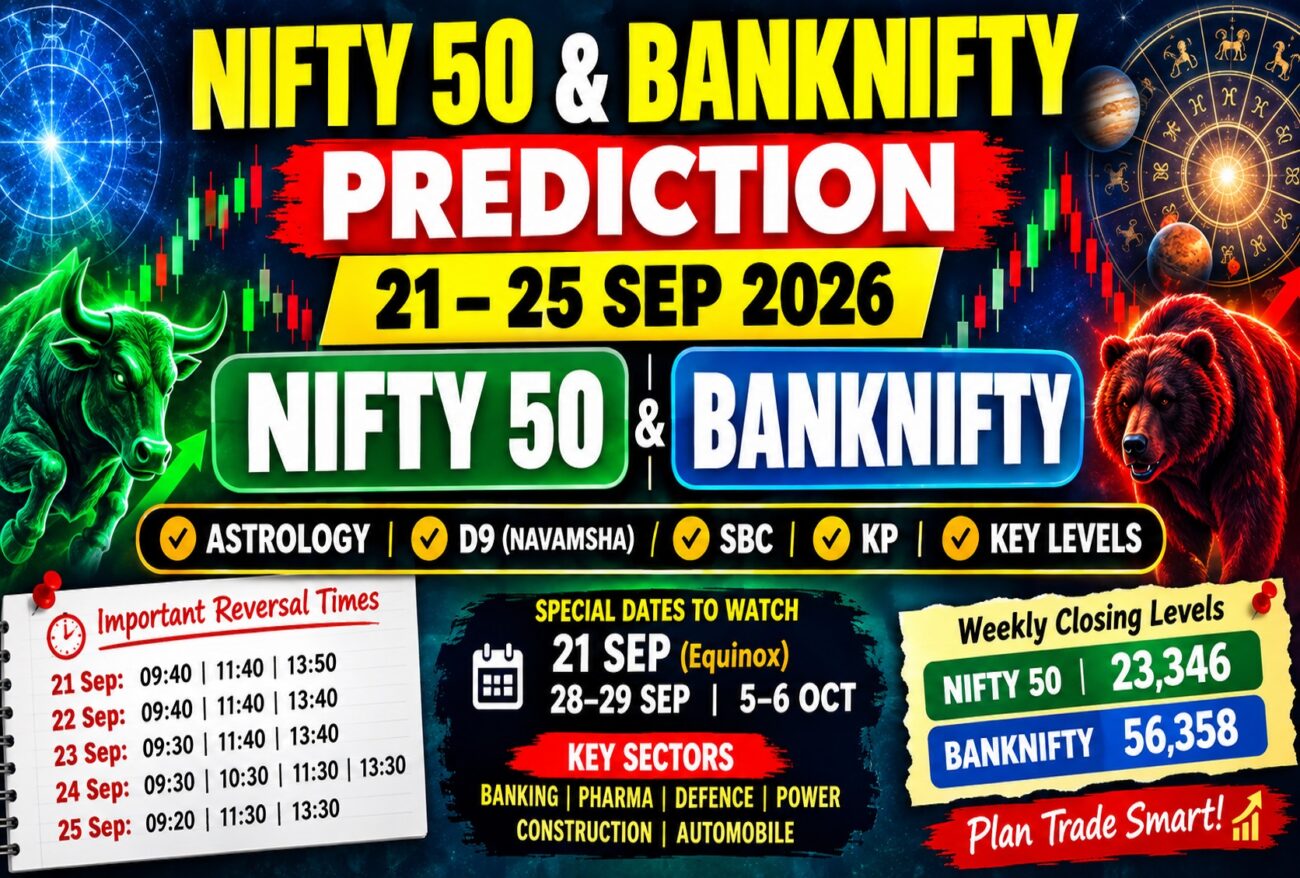
Market Prediction for 21–25 September 2026 Using Astrology, Navamsha, SBC & Technical Levels
The week of 21 September to 25 September 2026 could be an important period for the Indian stock market from an astrological perspective. The analysis combines Vedic Astrology, Navamsha (D9), Sarvato Bhadra Chakra (SBC), KP sub-lord indications and planetary conjunctions to identify possible market trends, volatility zones and intraday reversal timings.
For traders following financial astrology, the week is particularly interesting because of the September Equinox on 21 September, the recent Mars transit into Cancer, its conjunction with Jupiter, and several Moon-based planetary combinations during the trading week.
The analysis covers both NIFTY 50 and BANKNIFTY, along with important intraday support and resistance levels and potential reversal windows.
Important: This article represents an astrological/educational market analysis. It is not investment advice, and the projected direction or reversal timings should not be treated as guaranteed market outcomes. Traders should independently evaluate price action, volume, derivatives data, macroeconomic developments and risk before making any decision.
NIFTY 50 & BANKNIFTY Weekly Outlook
The overall character of the week may remain volatile, with changing intraday momentum rather than a uniformly directional market.
The planetary picture suggests that traders may encounter several intraday trend changes, particularly around the identified reversal windows.
The five trading sessions show different combinations:
| Date | Possible Market Character | Important Reversal Times |
|---|---|---|
| 21 Sep 2026 | Morning bullish bias followed by possible afternoon bearishness | 09:40, 11:40, 13:50 |
| 22 Sep 2026 | Volatile to bullish | 09:40, 11:40, 13:40 |
| 23 Sep 2026 | Bearish tendency with possible afternoon bounce | 09:30, 11:40, 13:40 |
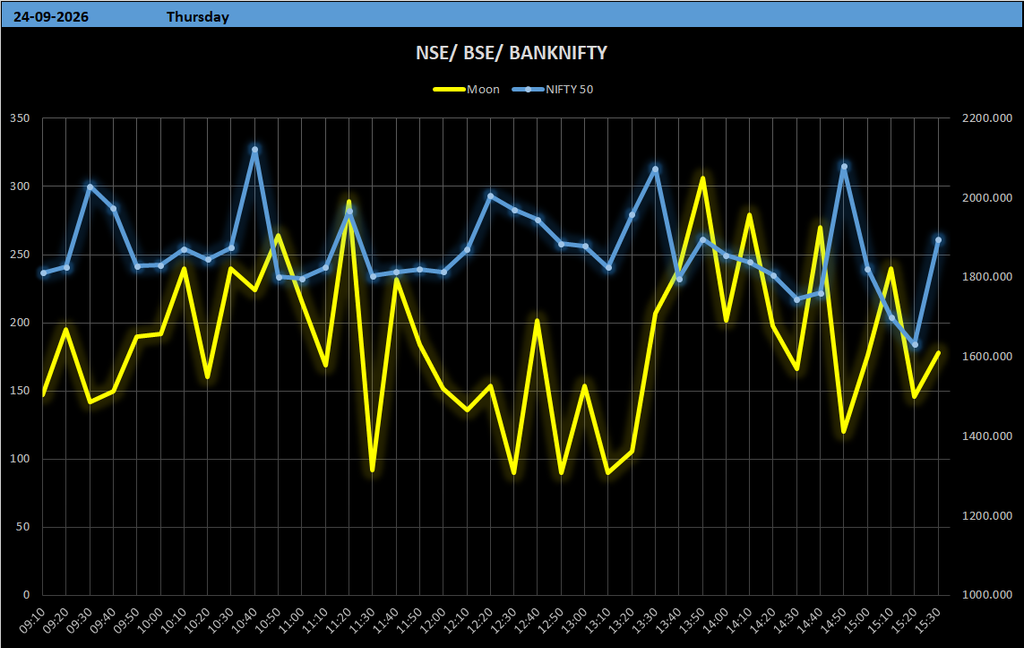
| 24 Sep 2026 | Bullish possibility | 09:30, 10:30, 11:30, 13:30 |
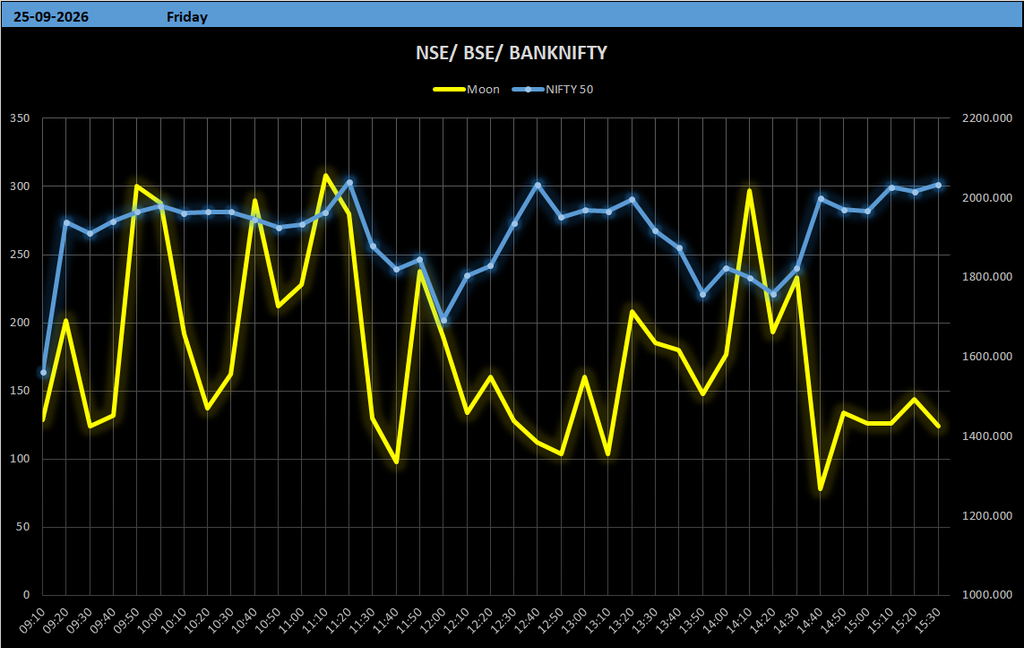
| 25 Sep 2026 | Volatile; strength may remain limited initially | 09:20, 11:30, 13:30 |
These timings should be treated as potential observation windows, rather than exact predictions of a market reversal.
21 September 2026: Important Equinox Day
Possible Market Trend: Morning Bullish → Afternoon Bearish
21 September 2026 stands out because it coincides with the September Equinox.
From the financial-astrology perspective, equinox periods are often watched as potential points of changing market rhythm. In this analysis, the date becomes particularly significant because the planetary combinations during the day show a transition from a relatively bullish morning configuration toward a potentially bearish afternoon configuration.
The morning has a bullish D9 conjunction, while the afternoon develops a bearish D9 conjunction with the Moon.
Therefore, the market may show a pattern of:
Morning strength → consolidation → possible reversal → afternoon weakness
Important reversal windows
- 09:40 AM
- 11:40 AM
- 01:50 PM
The 12:00 PM region is particularly important because the analysis indicates a possible reversal around noon.
Traders may therefore want to observe whether actual price action confirms the expected change in momentum around these windows.
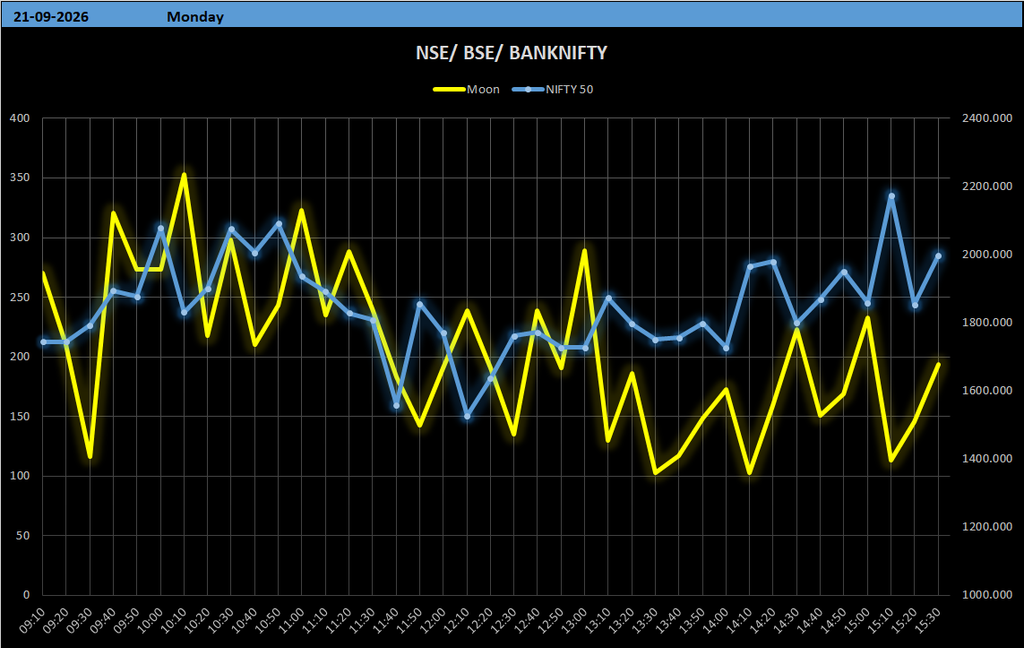
22 September 2026: Volatility With a Bullish Possibility
Possible Market Trend: Volatile to Bullish
The second trading session of the week may remain volatile but could retain a bullish undertone.
Two important factors are considered in this analysis:
- Bullish D9 conjunction
- Rahu/Ketu Vedha on the Moon according to SBC
The combination can potentially produce rapid changes in sentiment.
Rather than expecting a smooth upward movement, the market may experience:
Volatility → sharp movement → consolidation → another directional move
Important reversal windows
- 09:40 AM
- 11:40 AM
- 01:40 PM
The first half of the session should therefore be observed carefully, especially around the first two reversal windows.
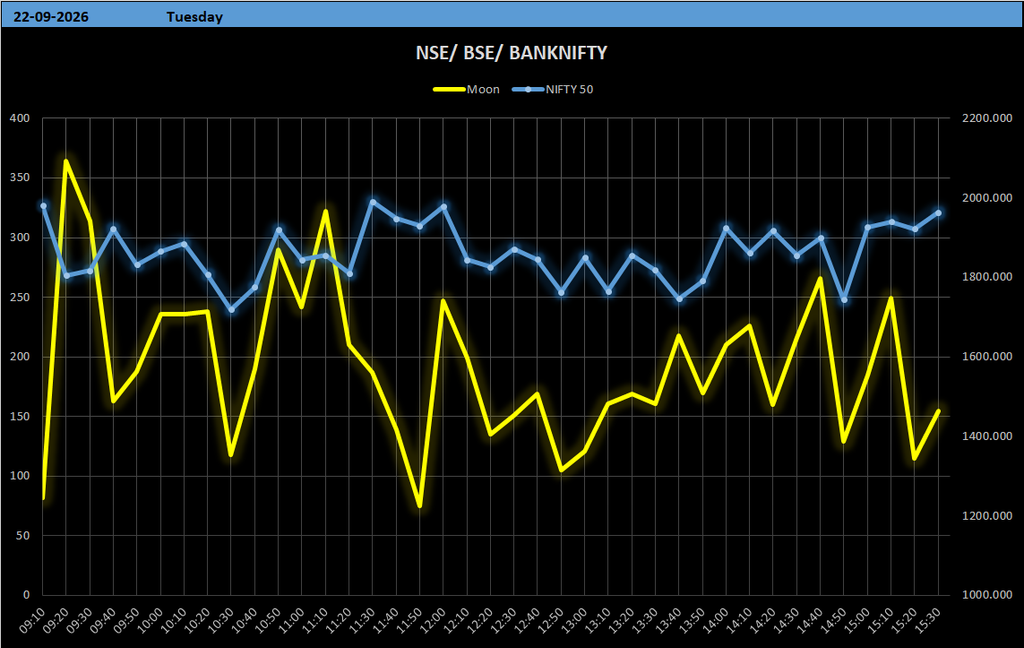
23 September 2026: Bearish Pressure With an Afternoon Bounce
Possible Market Trend: Bearish → Potential Bounce After 1:30 PM
The analysis for 23 September suggests comparatively stronger bearish pressure.
However, an important change may occur after approximately 1:30 PM.
The reason considered in the astrological framework is a Moon–Mercury conjunction in Navamsha, which may support a change in intraday momentum.
The potential pattern is therefore:
Weakness → selling pressure → consolidation → possible afternoon bounce
Key reversal windows
- 09:30 AM
- 11:40 AM
- 01:40 PM
The 1:30–1:40 PM region may be particularly important for observing whether the expected bounce develops.
24 September 2026: Bullish Day Potential
Possible Market Trend: Bullish
Among the five sessions, 24 September has a relatively straightforward bullish indication in the supplied analysis.
The primary factor is a bullish Moon conjunction in D9.
This may create a more supportive environment for the market compared with some of the other sessions.
However, even on a potentially bullish day, intraday corrections and reversals can occur.
Important reversal windows
- 09:30 AM
- 10:30 AM
- 11:30 AM
- 01:30 PM
Because several reversal windows are identified, the session may still contain multiple phases of intraday movement.
25 September 2026: Volatility and Limited Early Strength
Possible Market Trend: Volatile
The final trading session of the week may remain volatile.
Although the Moon receives a bullish conjunction in D9, the KP sub-lord indication suggests relatively low strength until approximately 1:30 PM.
This creates an interesting conflict between the broader bullish D9 indication and the weaker KP sub-lord strength.
Consequently, the market may show:
Initial weakness/sideways movement → volatility → possible improvement later
Key reversal windows
- 09:20 AM
- 11:30 AM
- 01:30 PM
The 1:30 PM region becomes particularly important because the analysis suggests that strength may improve after this period.
Major Planetary Factors for the Week
September Equinox — 21 September 2026
The September Equinox occurs on 21 September 2026 and makes this date an important observation point within the market-astrology framework.
The equinox represents an astronomical transition and, in financial astrology, such dates are often monitored for potential changes in market behaviour.
For this week’s analysis, 21 September is particularly significant because it also coincides with an intraday transition between bullish and bearish D9 configurations.
Mars Transit Into Cancer
Another major factor is the Mars transit into Cancer on 19 September.
According to the supplied analysis, Mars subsequently forms a conjunction with Jupiter.
This combination is being interpreted as potentially creating bearish sentiment in certain sectors.
The sectors specifically identified for observation are:
- Banking
- Pharmaceuticals
- Defence
- Power
- Construction
- Automobiles
This does not imply that every stock within these sectors must decline. Rather, these are the sectors highlighted by the astrological framework for closer observation during the period.
Actual sector performance should be compared with price action, relative strength, volume and broader market conditions.
Mars–Venus Square and New Moon
Another potentially important configuration is the Mars–Venus square aspect with the New Moon.
Within the framework used for this analysis, this combination may act as a potential market-change indicator.
Therefore, traders following planetary cycles may want to monitor the period around this configuration for:
- Sudden volatility
- Sector rotation
- Trend changes
- Intraday reversals
- Breakouts or failed breakouts
The key point is not to assume that the planetary configuration itself determines price direction, but to observe whether market structure confirms the astrological timing.
Potential Reversal Dates: 28–29 September and 5–6 October
Beyond the immediate trading week, the analysis identifies two future windows that deserve attention.
28–29 September 2026
This period may become an important reversal window.
5–6 October 2026
Another potentially significant period appears around 5–6 October, due to several planetary combinations occurring within a relatively short period.
The analysis specifically highlights:
- Mercury–Venus conjunction
- Moon–Jupiter conjunction
- Moon–Mars conjunction
When several planetary combinations occur close together, financial astrologers may monitor the surrounding dates for changes in market rhythm.
These dates should be treated as potential time windows for observation, not predetermined reversal dates.
BANKNIFTY Intraday Support & Resistance: 21–25 September 2026
The following levels are the supplied weekly levels for BANKNIFTY.
| Intraday Support | Intraday Resistance |
|---|---|
| 56,328 | 56,388 |
| 56,268 | 56,448 |
| 56,178 | 56,538 |
| 56,058 | 56,658 |
| 55,878 | 56,838 |
| 55,608 | 57,108 |
| 55,308 | 57,408 |
| 54,948 | 57,768 |
| 54,498 | 58,218 |
| 54,018 | 58,698 |
| 53,478 | 59,238 |
| 52,848 | 59,868 |
| 52,188 | 60,528 |
| 51,468 | 61,248 |
| 50,658 | 62,058 |
| 49,818 | 62,898 |
| 48,918 | 63,798 |
BANKNIFTY Weekly Closing Level
56,358
The supplied framework identifies 56,358 as the weekly closing level.
Traders can use the surrounding support and resistance bands as reference points and then confirm them with actual market structure.
NIFTY 50 Intraday Support & Resistance: 21–25 September 2026
The supplied NIFTY 50 levels are:
| Intraday Support | Intraday Resistance |
|---|---|
| 23,316 | 23,376 |
| 23,256 | 23,436 |
| 23,166 | 23,526 |
| 23,046 | 23,646 |
| 22,866 | 23,826 |
| 22,596 | 24,096 |
| 22,296 | 24,396 |
| 21,936 | 24,756 |
| 21,486 | 25,206 |
| 21,006 | 25,686 |
| 20,466 | 26,226 |
NIFTY 50 Weekly Closing Reference
23,346
The supplied analysis identifies 23,346 as the weekly closing reference.
Daily NIFTY 50 & BANKNIFTY Strategy Framework
Rather than using astrology in isolation, this weekly analysis can be applied through a confirmation-based framework.
Step 1 — Identify the Time Window
Mark the day’s important reversal times before the market opens.
Step 2 — Observe Price Action
Watch how NIFTY 50 and BANKNIFTY behave as the identified time approaches.
Step 3 — Check Support and Resistance
Compare price with the supplied intraday levels.
Step 4 — Look for Confirmation
A potential reversal becomes more meaningful when the time window coincides with:
- Support/resistance reaction
- Breakout failure
- Candlestick reversal
- Volume expansion
- Change in intraday trend
- Momentum divergence
Step 5 — Avoid Assuming Direction
An astrological reversal time indicates a possible timing window, not necessarily whether the market must move upward or downward.
The actual price structure should determine the observed direction.
Weekly Summary: 21–25 September 2026
The week may be characterized by frequent intraday changes and volatility.
21 September
Morning bullish → possible afternoon bearish reversal
22 September
Volatile with bullish possibility
23 September
Bearish tendency → possible bounce after 1:30 PM
24 September
Bullish possibility
25 September
Volatile with relatively low strength until around 1:30 PM
The combination of D9 conjunctions, Moon configurations, SBC indications, KP sub-lord strength and major planetary transits creates several potential timing windows throughout the week.
Key Dates to Watch
For traders following financial astrology, the following dates stand out in the broader analysis:
21 September 2026
September Equinox + intraday D9 transition
28–29 September 2026
Potential upcoming reversal window
5–6 October 2026
Multiple planetary conjunctions may create another important observation window
Final Takeaway
The week of 21–25 September 2026 presents a combination of potentially significant astronomical and astrological timing factors.
The most important feature of the week is not simply a bullish or bearish bias, but the possibility of multiple intraday changes in market momentum.
The major observation points are:
21 Sep: 09:40, 11:40, 13:50
22 Sep: 09:40, 11:40, 13:40
23 Sep: 09:30, 11:40, 13:40
24 Sep: 09:30, 10:30, 11:30, 13:30
25 Sep: 09:20, 11:30, 13:30
The supplied weekly reference levels are:
BANKNIFTY Weekly Closing: 56,358
NIFTY 50 Weekly Closing: 23,346
The most useful approach is to treat these astrological timings as observation windows and combine them with actual price action, support/resistance, volume and technical confirmation.
For educational purposes, this framework demonstrates how Vedic Astrology, Navamsha, SBC, KP and market levels can be brought together into a structured financial-astrology analysis.
Market astrology should never be treated as a guarantee of future price movement. Markets can be affected by news, global markets, economic data, institutional flows and unexpected events at any time.
