🔮 Introduction: Time, Price & Planetary Balance
In the world of technical analysis and financial astrology, the most powerful turning points are often hidden in natural cycles. One of the most accurate and time-tested methods for finding major support and resistance levels is based on the Equinox and Solstice points of the year — the four sacred markers when day and night achieve perfect balance or reach extremes.
This method works across any financial instrument — whether it’s Nifty 50, BankNifty, Gold, Crude Oil, Bitcoin, or S&P 500 — because every market vibrates with the same universal time cycle energy.
These four solar turning points divide the year into four quarters, representing Gann’s 90° cycle divisions. When properly used, they reveal future reversal zones, price barriers, and hidden supports that conventional indicators fail to detect.
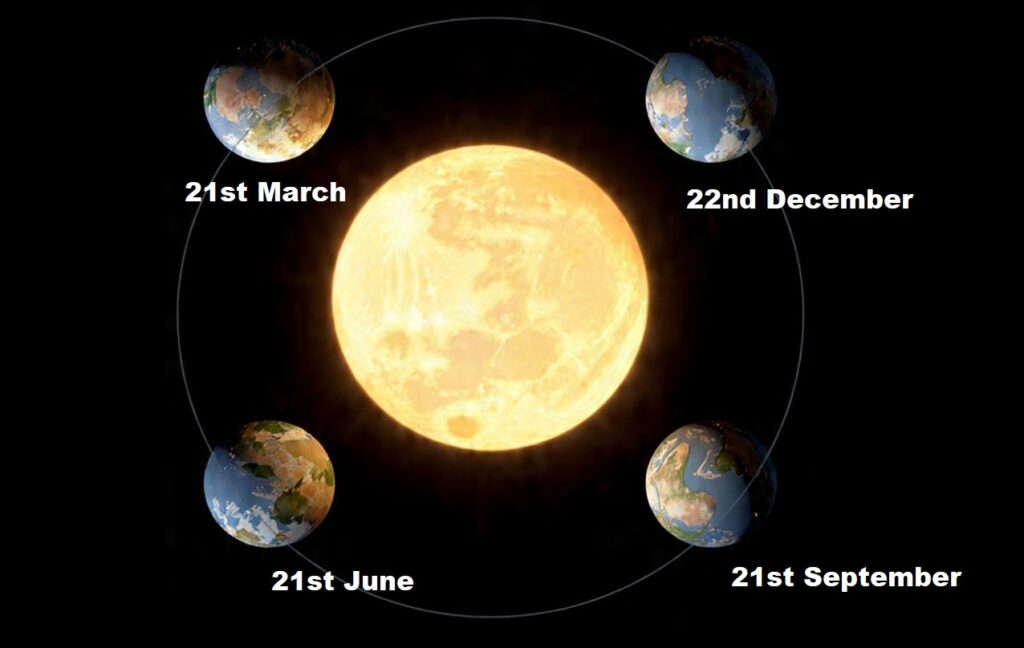
☀️ Understanding the Four Key Solar Points
| Event | Date (Approx.) | Symbolic Meaning | Market Behavior |
|---|---|---|---|
| Vernal Equinox (Spring) | 20–21 March | Balance of light and darkness, renewal | Often marks start of new bullish cycles |
| Summer Solstice | 20–21 June | Longest day, solar peak | Resistance zone or market top |
| Autumnal Equinox | 22–23 September | Balance again, change of season | Strong reversal or continuation pivot |
| Winter Solstice | 21–22 December | Shortest day, solar bottom | Major support or accumulation phase |
According to WD Gann, time and price are interlinked. Every 90 days (approx. 3 months), the market completes a natural energy quadrant, and highs/lows formed around these dates act as vibration anchors for the following quarter.
📊 Step-by-Step: How to Mark Support & Resistance Using Equinox–Solstice Method
Step 1: Identify Equinox & Solstice Dates
Mark the following fixed dates on your chart each year:
- March 20 (Spring Equinox)
- June 21 (Summer Solstice)
- September 23 (Autumn Equinox)
- December 21 (Winter Solstice)
You can extend lines vertically across multiple years to visualize recurring time cycles.
Step 2: Mark the High & Low Around These Dates
- Take a 3–5 trading day window before and after each Equinox or Solstice.
- Identify the highest high and lowest low during that time period.
- These levels become your Quarterly Vibration Points (QVPs) — acting as support and resistance for months ahead.
For example:
- If Nifty made a high near 23rd June, that level often becomes a strong resistance until the next Equinox.
- Conversely, if a low was formed near 21st December, it often acts as a base or support during the next quarter’s rallies.
Step 3: Extend Lines Forward
Draw horizontal lines from each high and low into the next quarter.
You’ll notice that price respects these levels multiple times — either bouncing or consolidating near them.
This is because these points represent natural harmonic frequencies of the time–price balance.
Step 4: Combine with Gann Angles or Square of 9
Once you have the equinox–solstice highs and lows marked, combine them with:
- Gann 45° or 1×1 angle lines
- Square of 9 levels around those price points
- Astrological transits (Sun or Moon crossing the same degree as the equinox or solstice sign, i.e., 0° Aries, 0° Cancer, 0° Libra, 0° Capricorn)
This will amplify accuracy — the intersection of time and price vibration often produces major breakout or breakdown points.
Step 5: Validate with Volume and RSI Divergence
If price approaches an equinox-derived support/resistance level with:
- Low volume → false breakout
- High volume → genuine move
- RSI divergence near the line → high probability reversal
This fusion of astro time cycle + classical technical indicators brings you close to Gann’s ideal of “Balance Between Time and Price”.
📅 Practical Application Example
Let’s say:
- Gold made a high of ₹73,250 around 21st June (Summer Solstice).
- That same level acts as a strong ceiling for the next 90 days until the Autumn Equinox (23rd September).
- Around September, the Sun crosses 0° Libra — if the price fails to close above that solstice high, it signals distribution and a trend reversal.
- Similarly, a low made around 21st December becomes a strategic support zone for the first quarter of the next year.
This cycle repeats annually, giving traders a natural rhythm map of the market.
🌗 Why It Works
The Sun’s position defines the Earth’s magnetic and gravitational shifts, which in turn affect human behavior, collective sentiment, and money flow.
Just as tides respond to the Moon, market sentiment responds to solar cycles.
Equinoxes and Solstices represent emotional extremes — moments when collective psychology changes direction.
In Gann’s words:
“When time and price square out, a major change in trend is inevitable.”
🧭 Works on Every Market
This method has been successfully tested on:
- Stocks (e.g., Nifty, Reliance, TCS)
- Commodities (Gold, Silver, Crude)
- Indices (S&P 500, Nasdaq, Nifty 50, BankNifty)
- Cryptocurrencies (Bitcoin, Ethereum)
Because these celestial time points influence global investor psychology, not just one country or sector.
📌 Conclusion
By aligning technical charting with cosmic time cycles, traders can gain a profound edge.
Marking highs and lows around Equinox and Solstice days helps identify natural quarterly pivot zones, revealing where market energy changes direction.
Combine this with WD Gann’s angle analysis, planetary transits, and volume confirmation, and you have one of the most reliable hybrid techniques to map support, resistance, and reversal zones across any financial market.
One thought on “Equinox & Solstice Trading Technique: Discovering Hidden Support and Resistance Levels Across All Markets”