
Forecast, Volatility Drivers, Sector Impact & Key Levels for NIFTY 50 & BANKNIFTY
Market Overview: Geopolitical Volatility to Drive Trading Action
The upcoming week is shaping up to be highly volatile for financial markets worldwide, with the dominant catalyst being the escalation of geopolitical tensions in the Middle East. Recent U.S.–Israel military strikes against Iran, including reported deaths of senior Iranian leadership, have intensified fears of broader conflict. These developments are already influencing global risk sentiment, commodity prices, and equities outlooks for this first week of March.
Analysts widely expect:
- Lower opens and risk-off biases in equity markets
- Rising crude oil prices, boosting energy inflation concerns
- Safe-haven flows into gold, silver, and defensive assets
- Expanded intraday volatility and wider trading ranges for benchmark indices.
This geopolitical “risk premium” is now an overarching force, overshadowing routine market fundamentals.
🌀 Astrological & Technical Signals: Volatility Windows Ahead
Planetary Event Highlights This Week
- Mercury has turned retrograde since Feb 27 — historically associated with communication breakdowns and increased market volatility.
- Lunar Eclipse on March 3 (Moon conjunct Ketu, Sun conjunct Rahu) traditionally coincides with sudden price swings and unpredictability in markets.
- Venus transit into Pisces — sensitivity around energy/commodity sectors.
🔥 Angarak Yog in Transit (24 Feb – 2 April 2026)
From 24th February to 2nd April 2026, Mars and Rahu are conjunct in Kumbh (Aquarius) forming Angarak Yog — a combination known in financial astrology for aggression, war signals, panic moves, and sudden volatility.
Mars represents conflict and fire, while Rahu amplifies chaos and unpredictability. Together, they often trigger:
- Geopolitical escalation
- Military tensions
- Commodity price spikes
- Sharp market swings and gap openings
This is especially sensitive amid ongoing US–Iran–Israel tensions.
🌌 High-Intensity Phase: 4 March – 20 March 2026
Between 4th March and 20th March, Mars and Rahu will also be in the same Nakshatra — Shatabhisha (Rahu-ruled) — increasing the probability of:
✔ Geopolitical tension rising
✔ Gold and silver price surge (safe haven demand)
✔ Crude oil volatility
✔ Sudden intraday reversals
This period overlaps with the Lunar Eclipse (3rd March) and Mercury retrograde, creating a strong cluster of volatility signals for global markets.
Traders should expect fast moves, news-driven spikes, and emotional market reactions during this phase.
Daily Astrological Reversal Times
Astro-technical traders may watch the following reversal timing windows as potential intraday pivot zones:
| Date | Expected Reversals (Local Trading Hours) |
|---|---|
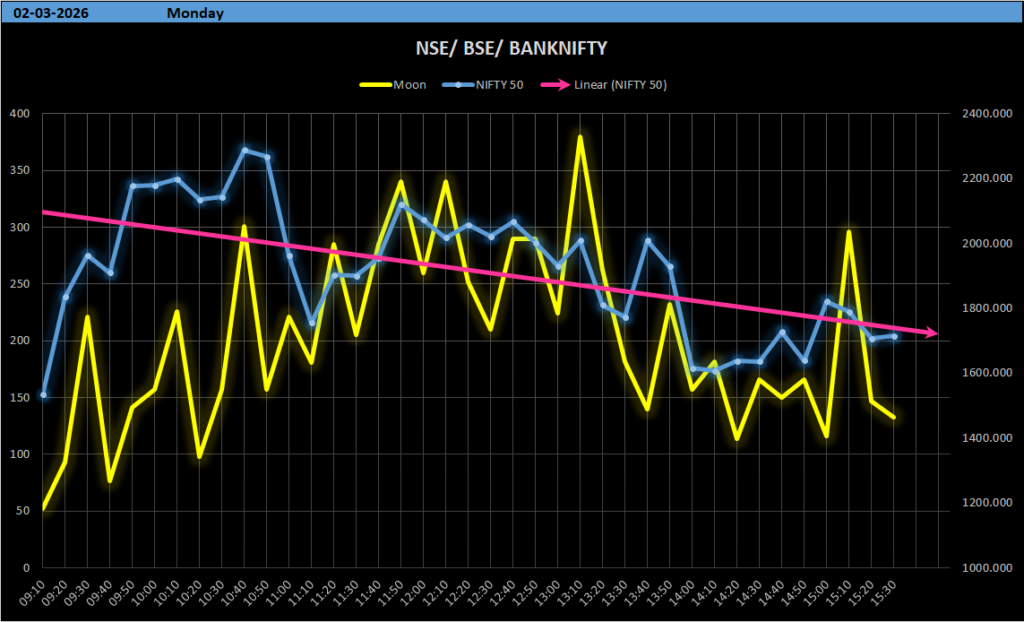
| 02-03-2026 | 09:20, 11:20, 13:20, 15:20 |
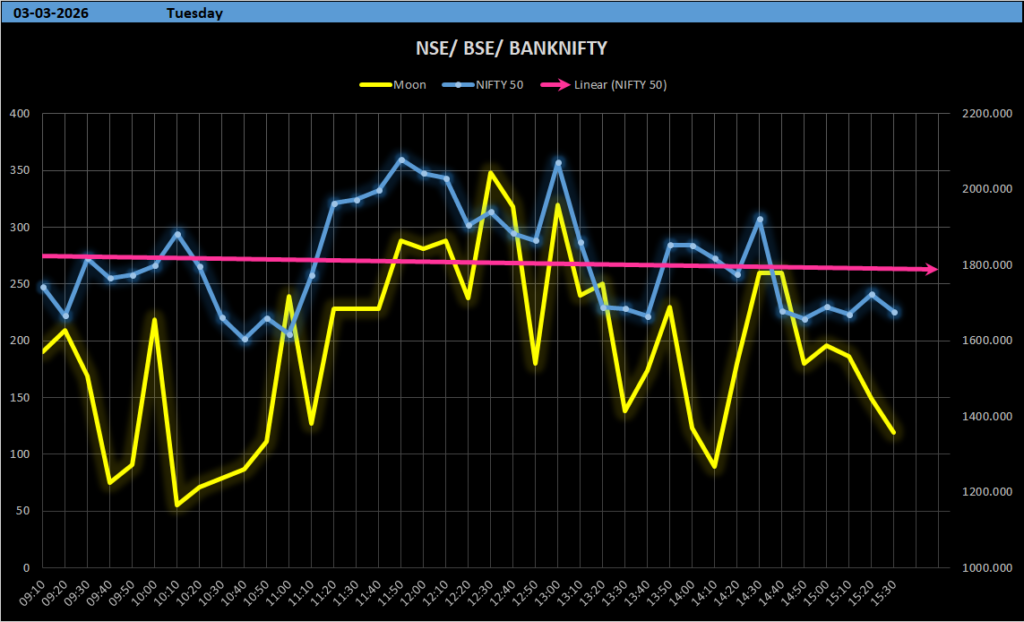
| 03-03-2026 | 09:20, 11:20, 13:20, 15:20 |
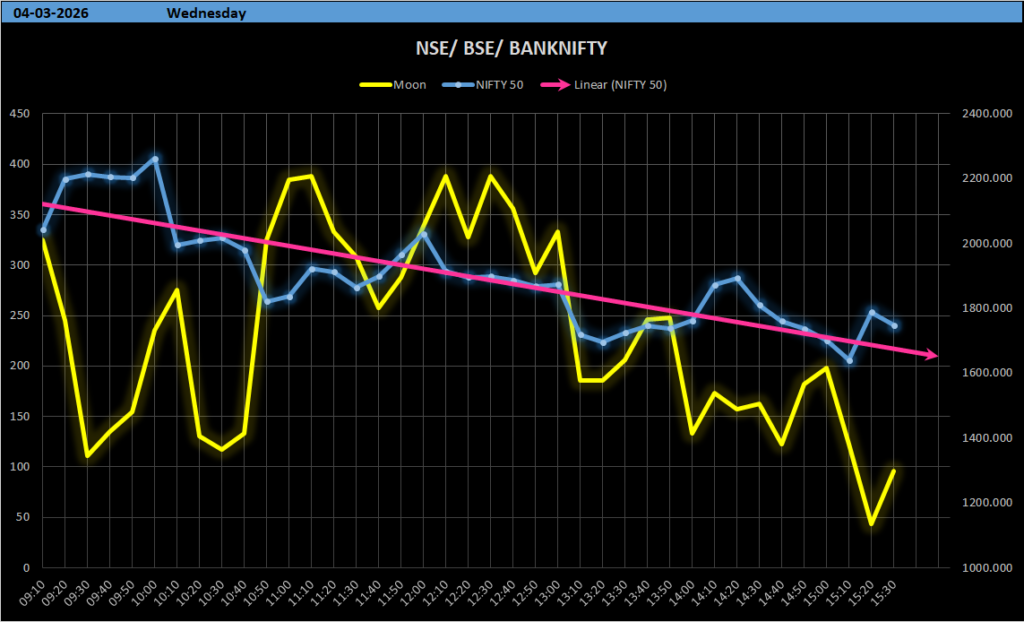
| 04-03-2026 | 11:10, 13:10, 13:45, 15:10 |
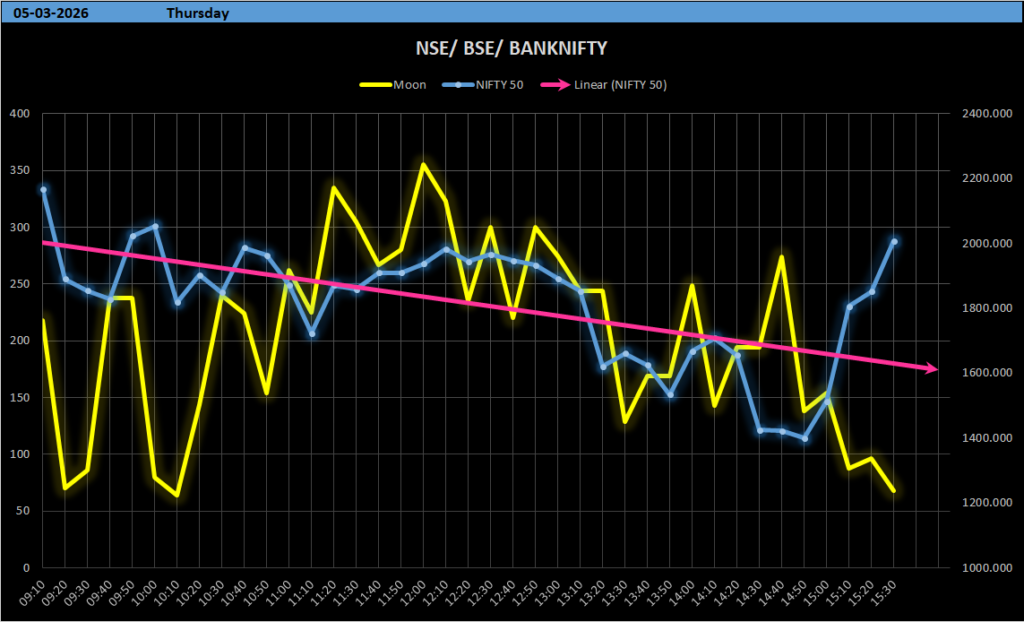
| 05-03-2026 | 11:10, 13:10, 14:30, 15:10 |
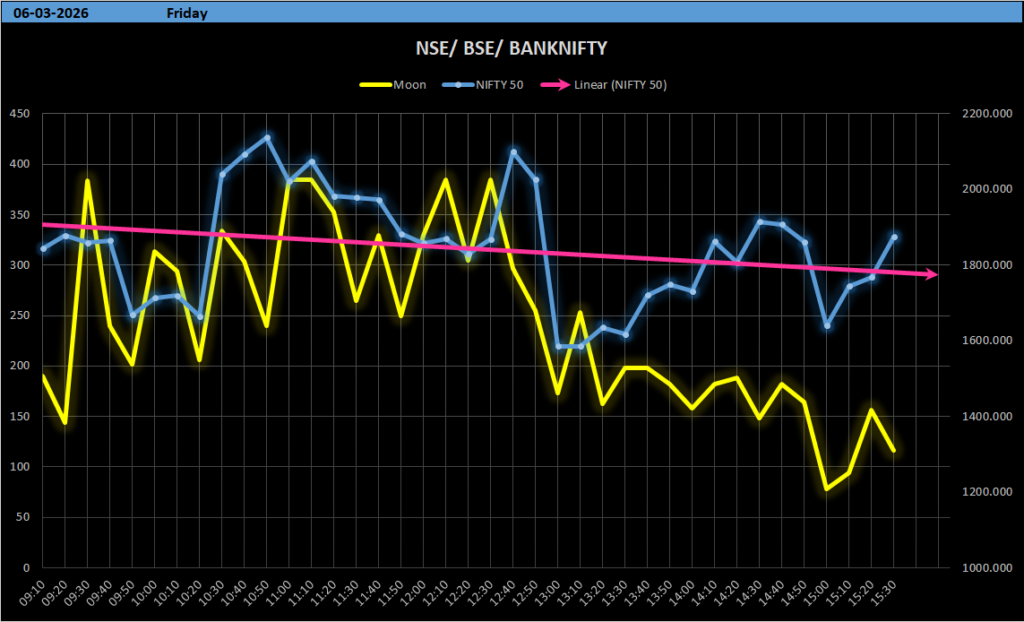
| 06-03-2026 | 09:30, 11:00, 13:00, 15:00 |
These windows may highlight intraday trend rotations, momentum shifts, or volatility expansions. Combine these with volume and price action for tactical entries/exits.
📊 Technical Levels to Watch: NIFTY 50 & BANKNIFTY
BANKNIFTY Intraday Support & Resistance
- Immediate resistance cluster near 60,559 – 60,619
- Key support band from 57,019 down to ~53,089
- Breakdown below 56,350–54,829 may accelerate selling pressure towards static Gann pressure dates
- Primary weekly closing level: 60,529
NIFTY 50 Intraday Support & Resistance
- Resistance zone: 25,268 → 26,228 → 27,518
- Support range: 24,428 → 23,318 → 22,298
- Weekly closing pivot roughly 25,178
📌 Important static Gann levels to watch:
26,235, 26,120, 25,955, 25,845, 25,425 — these zones are critical inflection points if volatility ramps up.
📉 Expected Market Behavior by Day
📅 Monday (02-Mar-2026)
Heavy volatility is expected as markets open after the weekend’s geopolitics.
- Crude oil has surged sharply, adding inflationary pressure to market sentiment.
- Bond and equity volatility likely high; indices may open lower.
- Expect choppy trade around the first reversal window.
📆 Tuesday (03-Mar-2026)
Astrological Lunar Eclipse energy peaks, historically linked with disruption and emotional selling.
- Momentum may swing rapidly; defensive sectors may outperform.
- Oil prices and gold could lead to relative strength.
📅 Wednesday (04-Mar-2026)
Market may attempt to stabilize, but broad allocation flows remain cautious — selling pressure could re-accumulate later in the session.
📅 Thursday (05-Mar-2026)
Volatility persists; astrological SBC Vedha influence on Moon suggests early stability, later weakness — potentially widening daily ranges.
📅 Friday (06-Mar-2026)
First half shows relative calm, second half resumes volatility — tactical traders should use reversal times for profit booking or hedging.
📊 Key Trading Levels (2nd March – 6th March 2026)
🔵 BANKNIFTY Levels
▶ Intraday Support:
60499, 60439, 60349, 60229, 60049, 59779, 59479, 59119, 58669, 58189, 57649, 57019, 56359, 55639, 54829, 53989, 53089
▶ Intraday Resistance:
60559, 60619, 60709, 60829, 61009, 61279, 61579, 61939, 62389, 62869, 63409, 64039, 64699, 65419, 66229, 67069, 67969
▶ Weekly Closing Level:
60529
▶ Important Static Gann Pressure Levels:
59370, 59140, 56240, 55780, 55650, 55570, 55210, 54070, 53740, 53040, 51940, 51230, 51030, 50610
🔵 NIFTY 50 Levels
▶ Intraday Support:
25148, 25088, 24998, 24878, 24698, 24428, 24128, 23768, 23318, 22838, 22298
▶ Intraday Resistance:
25208, 25268, 25358, 25478, 25658, 25928, 26228, 26588, 27038, 27518, 28058
▶ Weekly Closing Level:
25178
▶ Important Static Gann Pressure Levels:
26235, 26120, 25955, 25845, 25425, 25330, 25155, 25055, 24785, 24065, 23870, 23645, 23535, 23400, 23135, 22080
🏛 Sector & Asset Class Impacts
Strongest Relative Moves Likely
✔ Crude Oil & Energy Stocks:
With oil prices climbing on Middle East fears, energy sector equities and commodities may outperform.
✔ Gold & Silver:
Safe havens often gap higher when geopolitical risk spikes, and gold could remain elevated.
✔ USD & US Treasuries:
Risk-off moves often strengthen the dollar and fixed-income assets.
Pressure Zones
✖ Aviation, consumer discretionary, and inflation-sensitive sectors may underperform as crude price rises translate to input cost pressures.
✖ Cyclical small/mid caps could see selling due to risk aversion.
🧠 Strategic Trading Checklist
Bullish/Long-Bias Triggers
- Defensives breaking higher on strong volume
- Gold/energy outperforming broader markets
- Support holds at static pivot levels (e.g., 25,955 or 24,428 on NIFTY)
Bearish/Short-Bias Signals
- Lower opens after news shocks
- Failure at resistance clusters
- Rising crude oil shocks risk sentiment further
💡 Final Takeaway
The March 2–6, 2026 trading week is forecast to be volatile, bearish-biased initially, and technically driven by geopolitical shock waves and evolving macro sentiment. Astrological indicators in your data align with risk expansions and intraday reversals — combining these with macro fundamentals and key technical levels may help refine trade triggers.
Key risk drivers this week:
✅ Middle East escalation & oil price spikes
✅ Inflationary pressures from crude
✅ Rising volatility & risk-off sentiment
✅ Astrological reversal timing windows
Stay nimble, use intraday pivots wisely, and watch how crude oil and safe-haven asset moves influence broader equity trends.