
Traders across the world of trading widely recognize Fibonacci numbers and the Fibonacci retracement tool as some of the most essential technical analysis tools. They use Fibonacci levels in stocks, forex, commodities, and cryptocurrencies to determine potential support and resistance levels and to forecast possible price movements. In this comprehensive guide, we will explore the Fibonacci number sequence, its origins, and the mechanics of the Fibonacci retracement tool in detail.
What Are Fibonacci Numbers?
Fibonacci numbers are a sequence of numbers that follow a specific mathematical pattern. The sequence starts with 0 and 1, and each subsequent number is the sum of the two preceding numbers. Here’s the beginning of the Fibonacci sequence:
0, 1, 1, 2, 3, 5, 8, 13, 21, 34, 55, 89, 144, 233, 377, …
As you can see, each number is the sum of the two previous ones. The mathematical formula for this is:
F(n)=F(n−1)+F(n−2)F(n) = F(n-1) + F(n-2)
Where:
- F(0)=0F(0) = 0
- F(1)=1F(1) = 1
- F(2)=1F(2) = 1
- F(3)=2F(3) = 2
- And so on.
The Significance of Fibonacci Numbers in Nature
People have found Fibonacci numbers throughout nature; they are not just theoretical constructs. From the spirals of seashells to the arrangement of leaves on a stem, Fibonacci numbers appear in the most unexpected places. The golden ratio, represented by the symbol ϕ\phi, is derived from Fibonacci numbers and is approximately equal to 1.618. This ratio has been recognized as a symbol of beauty, balance, and harmony in nature, art, architecture, and even financial markets.
The Fibonacci Ratio (Golden Ratio) and Its Role
The Fibonacci sequence also gives rise to the Golden Ratio, which is the ratio between two consecutive Fibonacci numbers as they get larger. The ratio approaches 1.618, which is referred to as ϕ\phi (phi) or the Golden Ratio. Designers, architects, and professionals in various fields use this ratio not just for its mathematical significance but also to create aesthetically pleasing proportions.
In financial markets, this ratio plays a crucial role when we talk about Fibonacci retracement levels. Traders believe that price movements often adhere to the golden ratio, making it a useful tool for identifying potential price levels.
The Fibonacci Retracement Tool: A Game-Changer for Traders
The Fibonacci retracement tool is a popular technical analysis tool used to identify potential levels of support and resistance based on the Fibonacci sequence. This tool is widely used by traders to predict future price movements by identifying key levels where a market might reverse direction.
How Does the Fibonacci Retracement Tool Work?
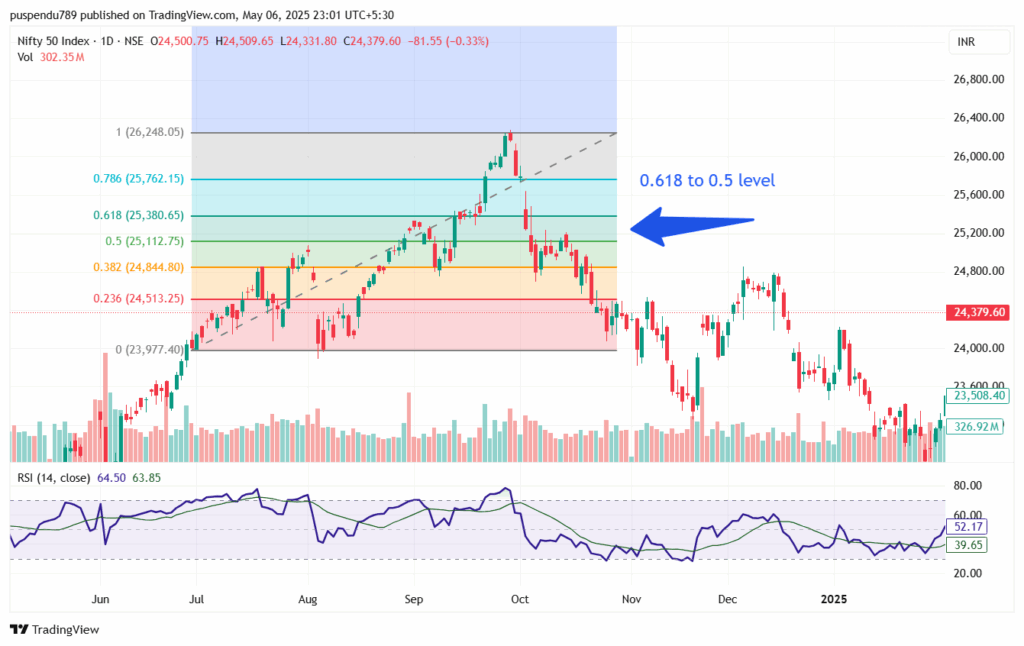
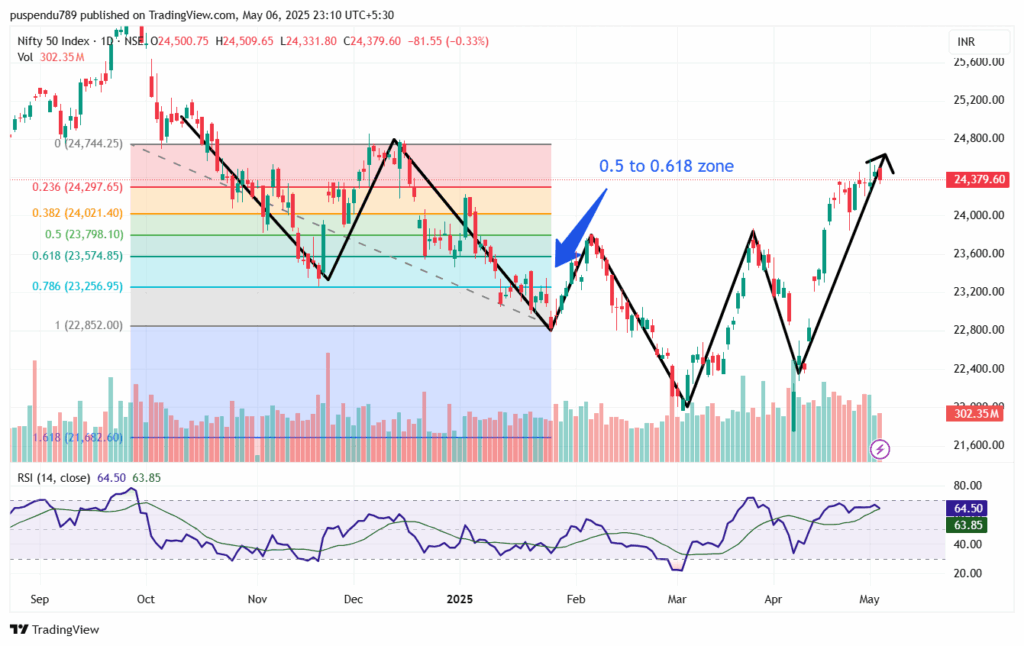
The Fibonacci retracement tool uses the key Fibonacci ratios of 23.6%, 38.2%, 50%, 61.8%, and 100%. These levels are plotted on a price chart between the high and low points of a price move. Traders believe that after a significant price movement (either upward or downward), prices will often retrace or pull back to one of these Fibonacci levels before continuing in the direction of the initial trend.
The process involves:
- Identifying the trend: The first step is to identify a major price movement (upward or downward) on the chart.
- Using the Fibonacci tool: Apply the Fibonacci retracement tool between the high and low of the trend. The tool will automatically generate horizontal lines corresponding to the Fibonacci levels.
- Analyzing the levels: The price will often retrace or pull back to one of these Fibonacci levels before either continuing in the direction of the initial trend or reversing. These levels serve as potential support and resistance zones.
Key Fibonacci Retracement Levels
The most important Fibonacci retracement levels are:
- 23.6%: This is often the first level to watch for a potential pullback. While not always a significant level, it can act as an early warning sign of a potential reversal.
- 38.2%: This level is one of the most commonly watched by traders. Many price retracements stop around the 38.2% level before continuing in the direction of the previous trend.
- 50%: While not technically a Fibonacci ratio, the 50% retracement level is significant and often acts as a key level of support or resistance. This level is considered by many traders to be the most critical.
- 61.8%: Known as the Golden Ratio, the 61.8% level is considered one of the most critical retracement levels. Prices often find support or resistance here before continuing their trend.
- 100%: This is the full retracement level, meaning that the price has retraced the entire move. A 100% retracement typically signals the end of the trend, and the price may reverse direction.
Using the Fibonacci Retracement Tool in Practice
Step-by-Step Guide to Applying Fibonacci Retracement
- Select the Trend:
- Identify the most recent significant price move, either an uptrend or a downtrend.
- In an uptrend, select the lowest point (start of the move) and drag the Fibonacci tool to the highest point (end of the move).
- In a downtrend, select the highest point (start of the move) and drag the Fibonacci tool to the lowest point (end of the move).
- Plot the Fibonacci Levels:
The Fibonacci retracement tool will automatically display horizontal lines at the 23.6%, 38.2%, 50%, 61.8%, and 100% levels, based on the high and low of the trend. - Watch for Price Reactions:
The price is likely to retrace to one of these Fibonacci levels before resuming its trend. Watch closely for signs of support or resistance at these levels, such as price consolidation, reversal candlestick patterns (like doji or hammer), or volume spikes. - Enter Your Trade:
Once you identify a key retracement level, you can place trades based on the price action at those levels. For example, you might enter a long position if the price bounces off the 38.2% retracement level during an uptrend, signaling that the trend is likely to continue. - Set Stop-Loss and Take-Profit:
After identifying the Fibonacci retracement level, set your stop-loss just beyond the next Fibonacci level to manage risk effectively. Similarly, set your take-profit target at the next major Fibonacci extension level (such as 161.8% or 261.8%).
Example: Fibonacci Retracement on an Uptrend
- Step 1: Suppose the price of a stock moves from $50 to $100.
- Step 2: Apply the Fibonacci retracement tool to the chart by selecting $50 (low) and $100 (high).
- Step 3: The Fibonacci tool will plot retracement levels at 23.6%, 38.2%, 50%, and 61.8%. Watch the price as it retraces to one of these levels. If it bounces off the 38.2% retracement level, it may indicate the uptrend is continuing.
Fibonacci Retracement in Different Markets
The Fibonacci retracement tool can be applied in virtually all markets, including:
- Stock Markets: Traders use Fibonacci retracement to find entry and exit points during corrections and pullbacks in stock prices.
- Forex Trading: Forex traders rely on Fibonacci levels to identify potential support and resistance zones for currency pairs.
- Commodities: Gold, silver, and oil traders use Fibonacci retracement to find key price levels during market retracements.
- Cryptocurrencies: In the highly volatile crypto market, Fibonacci retracement is used to pinpoint key levels of support and resistance for cryptocurrencies like Bitcoin and Ethereum.
Fibonacci Extensions: Beyond Retracements
While the Fibonacci retracement tool is widely used to predict levels of price pullbacks, the Fibonacci extension tool is often used to project potential price targets in the direction of the trend after a retracement has occurred.
Fibonacci extensions are plotted beyond the 100% level and can help traders identify potential areas of resistance (in an uptrend) or support (in a downtrend) as the price moves in the direction of the trend. Common Fibonacci extension levels include 161.8%, 261.8%, and 423.6%.
Limitations of the Fibonacci Retracement Tool
While the Fibonacci retracement tool is highly useful, it is important to recognize its limitations:
- Not Always Accurate: Price may not always respect Fibonacci levels, and a retracement may not occur at the predicted level.
- Works Best with Confirmation: The Fibonacci retracement tool is most effective when used in conjunction with other technical analysis tools such as trendlines, moving averages, or price action.
- Subjective Application: The retracement levels can vary depending on where you choose to start and end the Fibonacci tool. Different traders might apply the tool differently.
Conclusion: Mastering Fibonacci in Trading
The Fibonacci retracement tool is a powerful and widely used technical analysis tool that can help traders identify potential support and resistance levels in any market. By understanding the Fibonacci sequence, the golden ratio, and how to apply Fibonacci retracement and extension tools, traders can enhance their ability to predict future price movements and make more informed trading decisions.
Whether you’re trading stocks, forex, commodities, or cryptocurrencies, mastering Fibonacci retracement is a critical skill for any serious trader. Combine it with other analysis methods, and you’ll be able to identify trend reversals, project price targets, and increase your profitability.
Incorporate Fibonacci retracement in your trading strategy today, and take your trading to the next level by harnessing the power of the Fibonacci sequence.
2 thoughts on “Understanding Fibonacci Numbers and the Fibonacci Retracement Tool: A Complete Guide”