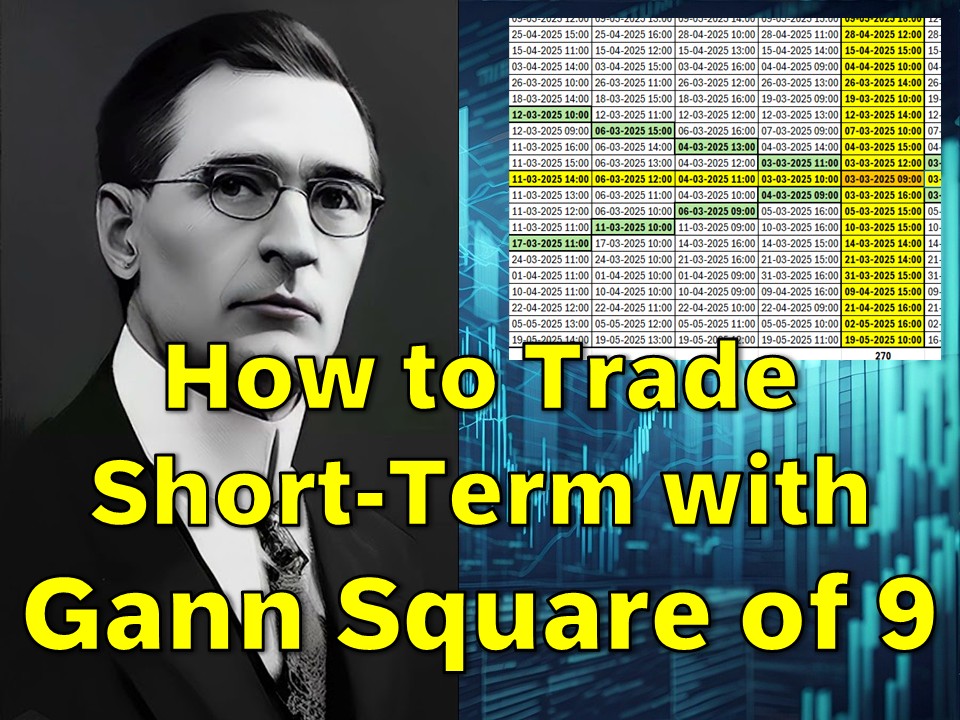
Discovering Market Turning Points Using the 1-Hour Candle Technique
When it comes to mastering the stock market, time and price are the two ultimate parameters every trader tries to synchronize. While many rely heavily on traditional indicators like RSI, MACD, or trendlines, a section of traders and analysts still explores the mystic yet mathematically grounded tools introduced by W.D. Gann. One such powerful tool is the Gann Square of 9, a dynamic instrument that has stood the test of time in predicting not only price reversals but also timing cycles. In this article, I will take you through a short-term trading technique using a unique Gann Square of 9 setup based on 1-hour candles, specially crafted in an Excel environment, designed to capture intraday and short-term turning points with astonishing accuracy.
This is a continuation of my previous article where I shared the Gann Square of 9 technique for determining support, resistance, and trend reversal dates on a daily chart. If you haven’t read it yet, I highly recommend going through that post first to grasp the foundational principles of how Gann’s mathematics is used to correlate price with time.
Understanding the Gann Square of 9
Before diving into the 1-hour candle method, let’s briefly revisit what the Gann Square of 9 is.
Developed by the legendary trader W.D. Gann, the Square of 9 is a spiral of numbers organized in a square format. At the center lies the number 1, and as we move outward in a clockwise spiral, the numbers expand, creating an angular relationship between numbers. Gann believed that certain angles (like 45°, 90°, 180°, and 360°) and time cycles derived from this square could help traders predict both price levels and reversal points in the market.
The beauty of the Square of 9 lies in its predictive nature. When you align price levels with time, based on angular degrees, you can often identify significant reversal points—whether on an intraday, daily, or even yearly basis.
Moving from Daily to Hourly: Why Short-Term Traders Need This
In the previous article, I explained how to use the daily Gann Square of 9 to forecast key support, resistance, and reversal dates based on Gann angles and squaring techniques. That method is fantastic for swing and positional traders.
However, markets have evolved. Intraday volatility has surged, and many traders now prefer short-term trades, especially in fast-moving instruments like indices, forex pairs, and commodities. This is where the 1-hour Gann Square of 9 technique shines. It brings Gann’s powerful theories to the micro-level, allowing you to time your entry and exit points within the same day or a 2-3 day window.
Introducing the 1-Hour Gann Square of 9 Method
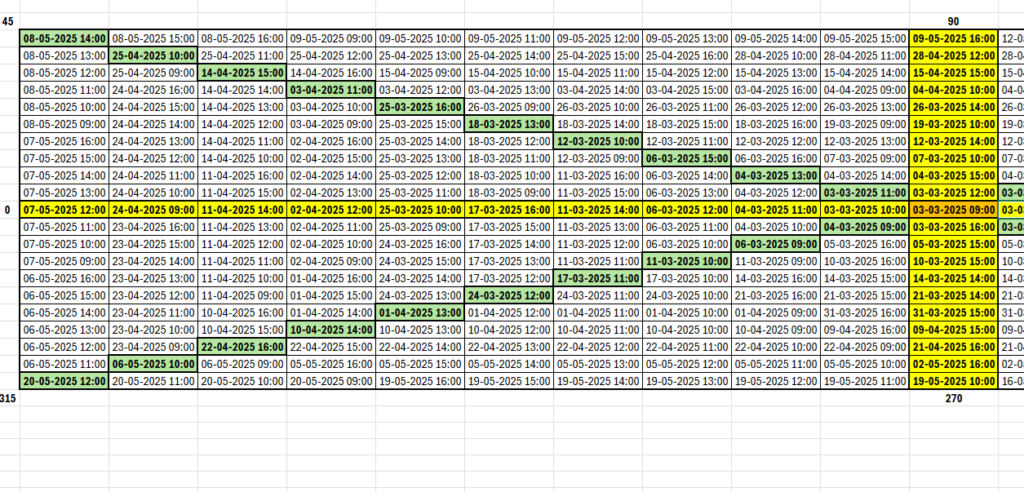
I’ve developed a unique Excel-based Gann Square of 9 tool specifically calibrated for 1-hour candles. This approach retains the core philosophy of Gann’s time-price alignment but brings it down to a granularity suited for short-term and intraday traders.
Let me clarify how this method works (without revealing the core Excel formula, which I use to maintain exclusivity and edge):
⏰ Time Progression
- The Excel sheet is designed to increment value by 1 hour per row, mimicking the market’s hourly movement.
- Each row represents the next trading hour, and the square recalculates and rotates dynamically.
- The sheet resets every trading day, starting from the first hourly candle of the day (typically 9:15 AM for Indian markets or 9:30 AM EST for US markets).
- If the current day is Friday, the tool skips the weekend and resumes from the first hour of Monday.
📊 Price-Time Mapping
- For each hourly interval, a new Gann angle or degree line is plotted.
- These angles relate to specific price vibration levels, which are projected from a pre-defined base value (either the low, high, or opening price of the week/day).
🔄 Predicting Reversal Points
- Using this method, I map critical hourly zones where price is likely to face support, resistance, or reversal.
- The tool has shown strong accuracy in predicting short-term reversals—including tops and bottoms—especially near 45°, 90°, 135°, and 180° degrees.
- These points often align with psychological levels or Fibonacci retracements, reinforcing their strength.
Practical Example: How I Predicted a Short-Term Reversal
Let’s consider a hypothetical trading scenario using Nifty 50:
- Assume on Monday at 9:15 AM, Nifty opened at 22,300.
- That value is set as the base in the Gann Square Excel.
- Each hour aligns with a degree point as the tool progresses through the day.
- Around 12:15 PM, the square aligns with a 135° angle, and the corresponding price (say, 22,520) becomes significant.
- I observe price approaching 22,520 and failing to cross with volume.
- Combining this with candlestick confirmation and volume divergence, I initiate a short position, targeting a 40–60 point fall in the next two hours.
- The market turns as expected.
Such micro-level time alignment has been instrumental in enhancing my short-term strategy—whether in stocks, indices, or commodities like Gold and Silver.
Key Features of the 1-Hour Gann Square System
Here are some core features of this technique that make it unique and powerful for short-term traders:
1. Auto Time Progression
- The tool automatically tracks the market hour-by-hour.
- No need to manually update timestamps. It continues incrementing during market hours and pauses automatically on weekends.
2. Time Price Vibration
- Each hourly point carries a vibration based on past market structures.
- The system filters noise from fake breakouts by focusing only on time-aligned price points.
3. Weekend Handling
- The system is programmed to skip non-trading days (Saturday & Sunday) and resume calculations from Monday’s first hour.
- This keeps the time-flow clean and predictive, avoiding gap-related misalignments.
4. Multiple Market Applicability
- Though developed for Nifty 50 and Bank Nifty, it works equally well on Dow Jones, NASDAQ, S&P 500, Crude Oil, and Gold with a few modifications in base calibration.
Ideal Use Cases: When and Where to Use It
You can use this Gann method to:
- Scalp hourly moves in index futures or currency pairs.
- Time intraday options entries, especially when theta decay is rapid.
- Combine with RSI divergence or volume analysis for sharper entry-exit points.
- Filter out false breakouts during high volatility sessions (Fed meeting days, RBI announcements, etc.).
- Predict overnight gaps when used with global market sentiment.
How This Complements the Daily Gann Square Strategy
In my earlier article, I explained how to use the daily Gann Square of 9 for:
- Long-term support-resistance mapping
- Date-based trend reversal forecasting
- Swing trade setup creation
This hourly Gann system complements that by acting as a precision entry tool within those broader reversal dates.
For example, suppose the daily Gann analysis shows a likely reversal between April 10–12. Using the hourly Gann Square, I can fine-tune entries around specific candles on April 11th, greatly improving my risk-reward ratio and minimizing drawdowns.
Important Tips While Using the 1-Hour Gann Square
- Don’t Trade Every Signal: Not every time-degree alignment leads to a reversal. Use supporting indicators or price action tools.
- Volume is Key: Validate reversal points using volume spikes, divergence, or candlestick confirmation.
- Avoid News Hours: The tool works best in technical environments. During major news releases, unpredictable volatility may disrupt the time-price harmony.
- Backtest It: Before going live, use it on historical data across instruments for at least 2–3 months to understand its behavior.
Final Thoughts: Is the 1-Hour Gann Square a Game Changer?
Absolutely. For those who believe in the power of time, the one-hour Gann Square tool brings a whole new dimension to trading. It helps decode the market’s intraday vibrations and gives you an edge where most traders rely only on price.
The accuracy and adaptability of this method have helped me spot reversals even before traditional indicators would react. Whether you are trading Nifty, Bank Nifty, Dow Jones, or Gold, this system can be your secret weapon—allowing you to predict with confidence and trade with discipline.
📌 Stay Connected
To dive deeper into my Gann studies, don’t forget to check out my previous article on how to use Gann Square of 9 to identify support, resistance, and trend reversal dates on daily charts. It forms the foundation of this short-term system.
Also, subscribe to my YouTube channel Stocklord – Trade Like a Boss’ for general insights and ‘Stocklord.in’ for more stock market strategies, Gann theory lessons, and live predictions.
2 thoughts on “How to Trade Short-Term with Gann Square of 9”