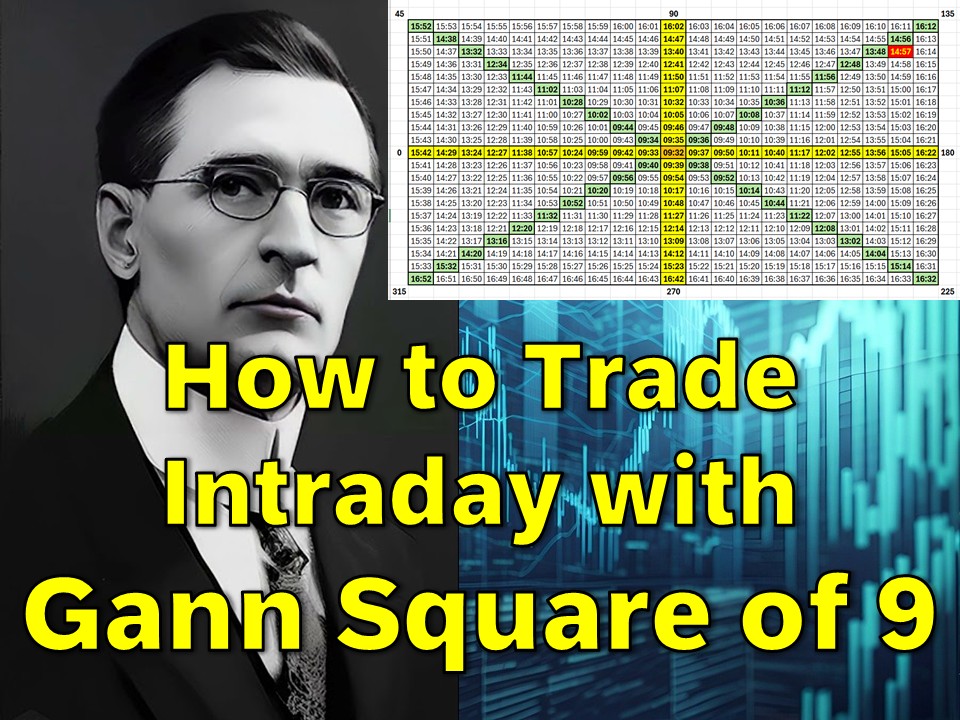
Welcome back to Stocklord.in, your go-to place for combining technical analysis with time-tested astrological and Gann-based tools. Today, I’m excited to introduce a powerful short-term trading tool based on W.D. Gann’s Square of 9, adapted for intraday use on 1-minute charts.
This method is incredibly effective for high-frequency traders, scalpers, and anyone who trades stocks, crypto, or commodities on an intraday basis.
💡 Important: If you haven’t already, please refer to my previous article on how to use the Gann Square of 9 for predicting support/resistance and daily trend reversal dates, where I’ve explained how to calculate levels based on Gann angles like 45°, 90°, 180°, etc. You’ll need that foundation to make the most of today’s strategy.
👉 Link to previous article:
📚 Gann Square of 9 for Daily Reversal Predictions
🔧 What is the Intraday Square of 9?
This is an Excel-based intraday timing tool built on the principles of the Gann Square of 9, but adapted for 1-minute candles.
- It is designed for short-term traders
- You can apply it to stocks, cryptocurrencies, and commodities
- It uses time as the base variable instead of price
- It predicts time-based turning points after the market starts
📊 The Concept: Time as the Key
Traditional Square of 9 methods use price numbers at the center to derive significant Gann angles. In this intraday version, we take a different approach:
✅ Instead of price, we put a specific 1-minute timestamp (the time of a key high or low) at the center of the Square of 9
From that time reference, the Square calculates future turning points using the Gann spiral of time. These predicted times can be reversal points or moments of volatility.
🕒 When and How to Use It?
✅ Use it on:
- Nifty, BankNifty, or any index or stock (on 1-minute chart)
- Commodities like gold, silver, crude
- Crypto markets (especially BTC, ETH)
⏰ Time Selection Logic:
- Wait for market opening (first 15-30 mins)
- Observe an important low or high
- That becomes your “initial time” input in the Square of 9
For example:
On a given day, Nifty makes a sharp low at 09:24 AM → This becomes your center point
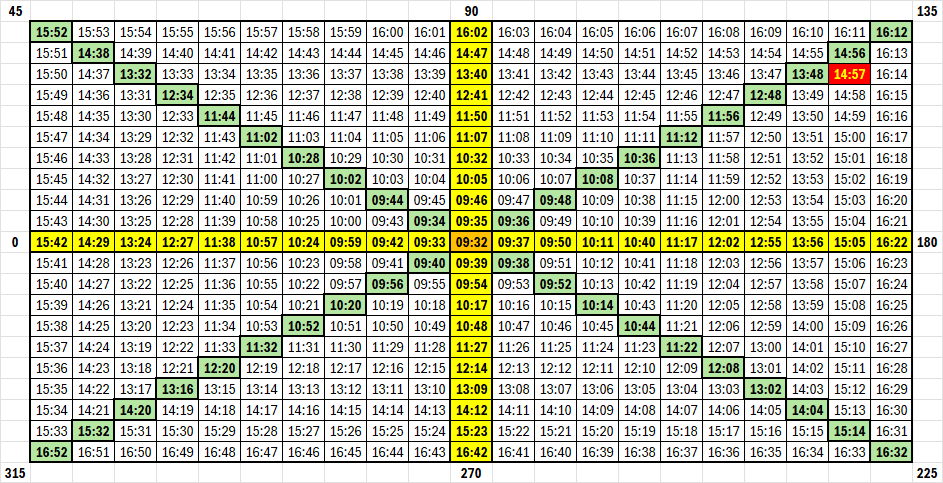
🧮 How It Works in Excel
I’ve created an Excel format where:
- The central cell of the Square holds your chosen 1-minute timestamp
- All other cells are filled by adding or subtracting time based on spiral values
- The values increase outward in a Gann spiral pattern, just like the price-based Square of 9
- Each cell shows a future minute-based timestamp
➡️ This creates a dynamic spiral of time where each cell is a potential reversal or breakout point.
🔁 Automatic Time Progression – 1-Minute Increment Logic
Unlike our earlier daily Square of 9 model, this format updates every cell by 1-minute increments, and the Square is filled using:
- Minute-level intervals in spiral formation
- For crypto, it runs 24×7
- For stock/commodity markets, we use trading hours only
📌 Note: In case of stocks or indices, the logic will automatically skip non-trading hours if you embed it into a full trading model.
🎯 How to Use the Predictions?
Once your time spiral is ready, watch out for future time points generated by the Square. At these predicted minutes:
- Check RSI or MACD for divergence
- Match it with a Gann angle-based price level (from your daily Square of 9)
- Watch volume and price action
✅ If RSI is showing overbought and the time hits a Gann-predicted point – it could be a good short entry
✅ If MACD is turning bullish near a predicted time + support – it could be a strong buy opportunity
📘 Real Example: Bank Nifty Intraday
Let’s say BankNifty made a low at 09:24 AM
We set 09:24 AM at the center of our Square of 9.
The spiral fills outward:
| Gann Spiral Step | Time Output |
|---|---|
| Center (0 step) | 09:24 AM |
| 1st Ring (1 min) | 09:25 AM |
| 2nd Ring (2 min) | 09:26 AM |
| … | … |
| 45th Spiral cell | 10:09 AM |
| 90th Spiral cell | 10:54 AM |
| 180th Spiral | 12:24 PM |
Now, if you observe sudden volume or RSI divergence at 10:54 AM or 12:24 PM, prepare for a reversal or big move.
🔗 Combine It with Price Square
Your daily Square of 9 gives price reversal levels like:
- 22325 (0°)
- 22400 (45°)
- 22530 (90°)
- 22700 (180°)
By merging time and price, your accuracy improves drastically:
“Price and time meeting at the same Gann angle = high probability setup”
🧰 Best Indicators to Use With This Strategy
While Gann provides timing tools, we must combine them with price indicators:
📈 RSI (Relative Strength Index)
- Look for divergence at Gann time
- Overbought/Oversold zone + Gann time = likely reversal
📉 MACD
- Look for crossover at or near the Square of 9 predicted time
- MACD + Gann time often aligns during strong intraday trends
🟩 Candlestick Patterns
- Engulfing, Doji, Pin Bars at predicted time = extra confirmation
📊 Apply to Crypto 24×7
For cryptocurrencies, there is no market close. So this system runs non-stop.
You can set any major low or high from the last 24 hrs as your center.
E.g.,
BTC makes a major low at 03:42 AM → Set 03:42 as center → Watch for reversals at 30-min, 90-min, 180-min spirals.
You can also auto-refresh live data in Excel with APIs (optional for advanced users).
🔁 Sample Use Case Summary
| Time | RSI | MACD | Gann Time Match | Action |
|---|---|---|---|---|
| 10:54 AM | 78 (OB) | Bearish X | Yes (90 min) | Short |
| 12:24 PM | 29 (OS) | Bullish X | Yes (180 min) | Long |
| 02:30 PM | 45 | Flat | No | Skip |
📥 Want the Excel Template?
I’ll be sharing this Intraday Square of 9 Excel format soon on excelabcd.co.in with automatic 1-minute spiral generation.
Download from here by visiting the article about how I made it.
Till then, feel free to request access by leaving a comment below or messaging through the contact form.
🧠 Final Thoughts
W.D. Gann always believed that time is more important than price. In this intraday model, we embrace that truth.
By identifying a key turning point and projecting time spirals from it, you gain an edge in timing your intraday trades—whether it’s Nifty, Bank Nifty, BTC, or Crude Oil.
This tool becomes even more powerful when paired with:
- Daily Square of 9 price levels
- RSI/MACD/Volume confirmation
- Astrological or planetary timing (for those who apply astro analysis)
🛠 Stay Tuned
💬 Comment below if you’d like to see:
- A video tutorial for the Excel system
- A live demo on Nifty or BTC chart
- Downloadable format for readers
And don’t forget to check out my main article on how to calculate the Square of 9 levels using angles for price reversals:
👉 How to Trade Short-Term with Gann Square of 9
👉 Comprehensive Guide to the Gann Square of 9
📌 Subscribe to stay updated
📲 Follow me on YouTube at Stocklord.in for regular stock market analysis and knowledge videos.
Happy Trading!
2 thoughts on “🔁 Intraday Square of 9 Strategy – 1-Minute Gann Time Prediction for Stocks, Crypto & Commodities”