
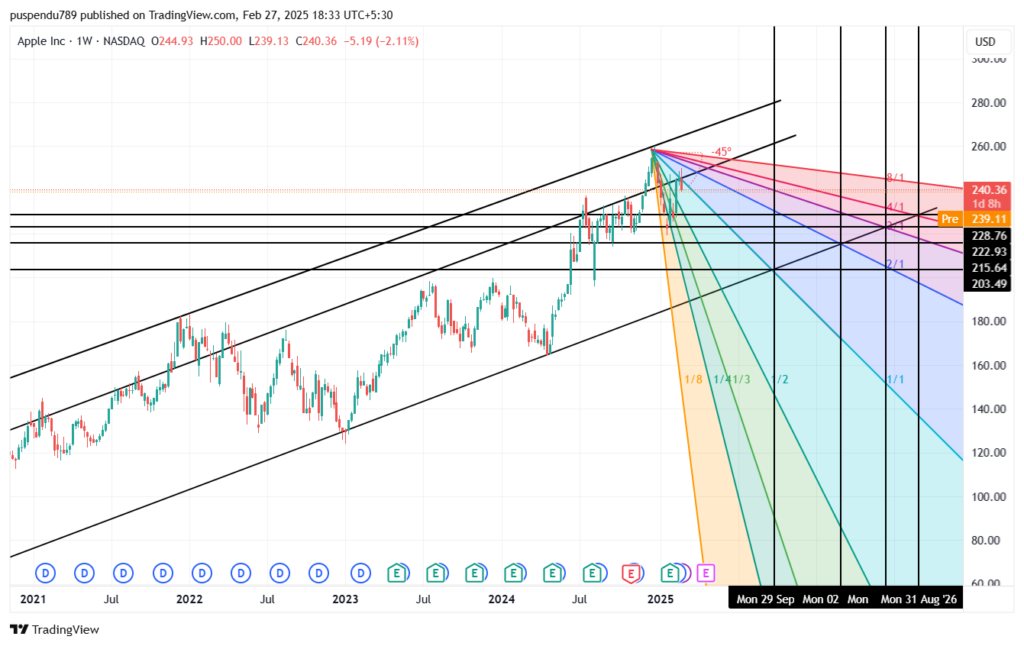
Apple Inc. (AAPL) is currently trading at $240, hovering near a crucial resistance level on the weekly chart. Investors are closely watching this level for a potential price reversal. Based on technical analysis and W.D. Gann’s methodology, Apple stock may be setting up for a downside move, with a target of $200 in the coming weeks.
Apple Stock Price Prediction: Technical Analysis
- Current Price: $240
- Key Moving Averages:
- 50-day SMA: $241 (resistance level)
- 200-day SMA: $225 (support level)
- Momentum Indicators:
- Apple’s recent price action suggests it is testing the 50-day moving average resistance. A failure to hold this level could trigger a bearish move.
- The stock is trading below its recent highs, indicating potential exhaustion in buying momentum.
Apple Stock Price Prediction: W.D. Gann Analysis
Support & Resistance Levels (Gann Square):
- Resistance Levels: $281, $273, $265, $257, $249, $241
- Support Levels: $233, $225, $218, $211, $204, $197
Gann Key Dates for Potential Highs/Lows:
- March 2025: 4th, 9th, 20th, 27th
- April 2025: 3rd, 14th, 24th
Gann Pressure Weeks:
- February 2025: 24th (Current week)
- March 2025: 18th
- April 2025: 7th, 28th
- May 2025: 19th
Gann Pressure Months:
- December 2024: Apple made a significant top
- December 2025: Expected to be the next critical turning point
Conclusion
With Apple stock currently testing a major resistance level at $241 (50-day SMA), a failure to break above this point could push prices lower. A breakdown below $233 could trigger a slide toward the next major support at $225 (200-day SMA). If bearish momentum continues, Apple could drop further towards the $200 level.
Traders should keep a close eye on upcoming Gann pressure dates and weeks, as these could coincide with significant market moves. Investors should exercise caution and manage risk accordingly as Apple stock approaches critical support and resistance levels.