
As the US stock market reaches new heights in early 2025, investors and traders are increasingly seeking insights to navigate the potential volatility ahead. With the Nasdaq 100 showing signs of exhaustion and the Buffett Indicator signaling a highly overvalued market, the stakes couldn’t be higher. By incorporating Gann Theory’s astrological timing principles, this article provides a comprehensive roadmap for identifying potential market turning points. Whether you’re a seasoned trader or a newcomer looking for reliable stock market predictions, understanding these key indicators is crucial for staying ahead of the game.
Why the Buffett Indicator Matters More Than Ever in 2025
The Buffett Indicator, also known as the Market Capitalization-to-GDP ratio, is currently at an alarming 205.1%, signaling that the US stock market is significantly overvalued. This ratio is a widely respected metric used by legendary investor Warren Buffett to gauge market frothiness. In times of high valuations, history has shown that markets are prone to corrections or prolonged consolidations.
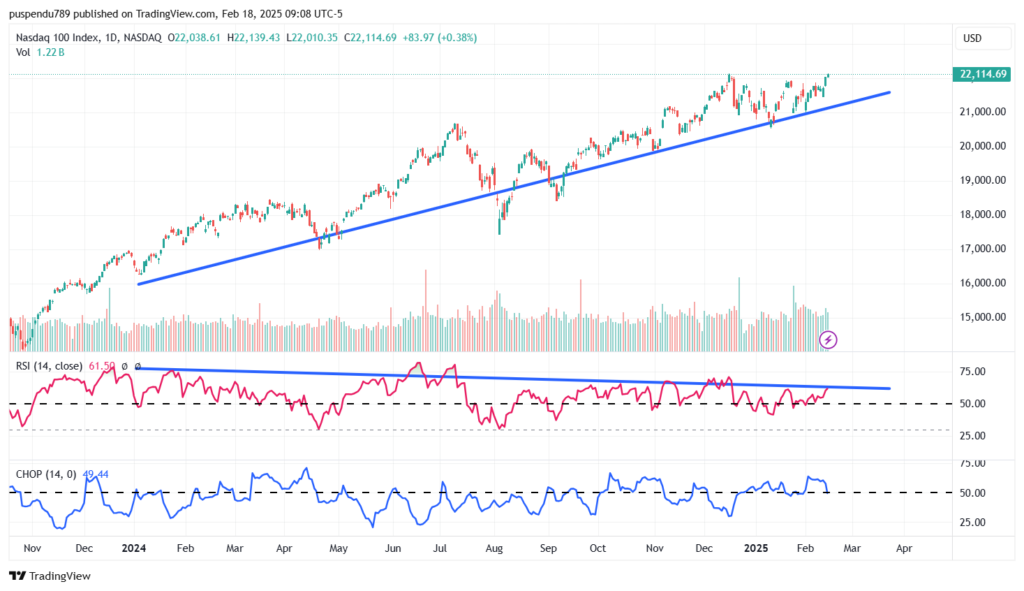
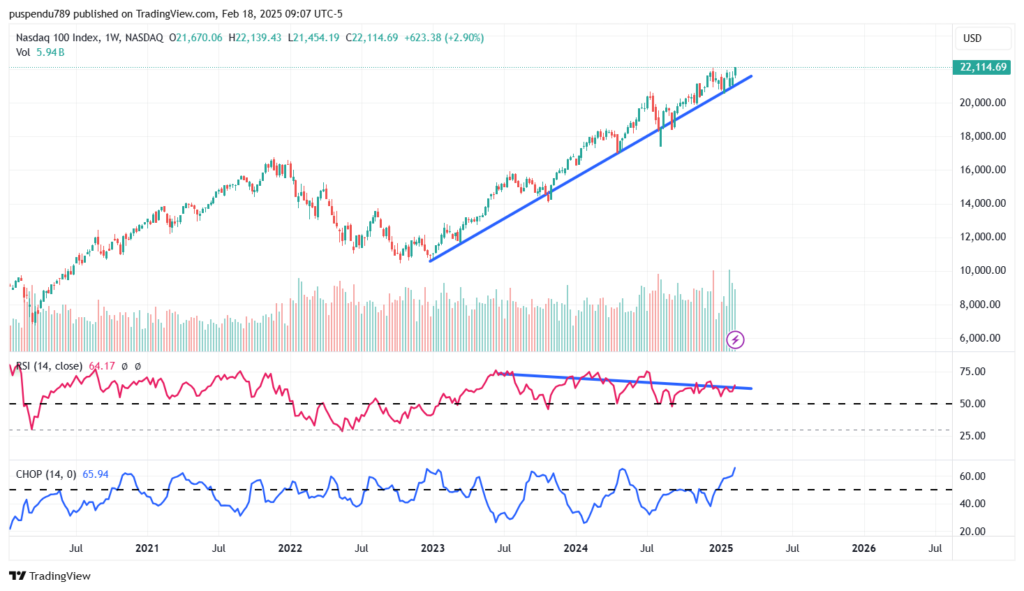
Nasdaq 100 RSI Divergence: A Warning Sign for Traders
The Nasdaq 100 is exhibiting RSI divergence on both its daily and weekly charts. Despite higher prices, RSI is trending lower—a classic signal that momentum is waning. Such divergences are often harbingers of market reversals, especially when combined with an overbought market environment.
Gann Theory: High-Pressure Months and Weeks for 2025 and Beyond
In addition to traditional technical analysis, Gann’s Theory offers a unique lens for market timing. You have identified the following high-pressure months and weeks for the US stock market:
Pressure Months:
- March 2025
- June 2025
- September 2025
- December 2025
- April 2026
Pressure Weeks (Starting Mondays):
- Current week (February 2025)
- April 14, 2025
- June 9, 2025
- August 4, 2025
- September 29, 2025
These pressure periods often coincide with significant market highs or lows, making them essential for traders and investors to watch closely.
Buffett Indicator Overview
The Buffett Indicator measures the ratio of total stock market capitalization to Gross Domestic Product (GDP). With the ratio standing at 205.1%, the market is considered highly overvalued. Historically, values above 120% have indicated excessive market exuberance.
Combined Analysis and Market Outlook
- Buffett Indicator Implication: The US stock market is notably overvalued, increasing the probability of a correction or significant consolidation.
- RSI Divergence: The weakening momentum in the Nasdaq 100 indicates vulnerability. If price action continues to rise while RSI declines, a trend reversal is likely.
- Gann Pressure Dates: The intersection of overbought conditions with critical Gann timeframes heightens the likelihood of market inflection points.
Short-Term Outlook:
- Immediate volatility is expected in February 2025, given the current pressure week.
- The market may test new highs before potentially reversing by mid-March 2025.
Medium-Term Outlook:
- June and September 2025 stand out as key months for market inflections.
- Investors should closely monitor price action and sentiment during these months for signs of trend exhaustion or acceleration.
Strategic Recommendations
For investors and traders:
- Risk Management: Tighten stop-loss levels on long positions, especially in overbought tech-heavy indices like the Nasdaq 100.
- Hedge Positions: Consider hedging strategies to protect against downside risks, especially as pressure months approach.
- Opportunistic Entry Points: If corrections occur during pressure weeks, evaluate potential entry points for long-term investments at more reasonable valuations.
Conclusion
The confluence of the Buffett Indicator, Nasdaq 100 RSI divergence, and Gann’s high-pressure timeframes suggest a critical period for the US stock market. While the market may continue its ascent in the short term, caution is warranted as we approach key pressure dates. Staying informed and agile will be essential for navigating the year ahead.
For more stock market analysis and predictions, visit Stocklord.in, where we provide daily technical analysis and astrological predictions to help you stay ahead of the market curve.
7 thoughts on “Analyzing the US Stock Market: Buffett Indicator, Nasdaq 100 RSI Divergence, and Gann Theory Insights”