
Technical analysis helps traders identify potential trend reversals and trading opportunities. One of the most powerful bullish signals occurs when the Relative Strength Index (RSI) is increasing while the stock price is decreasing. This pattern, known as bullish divergence, often indicates that downside momentum is weakening and a price reversal may be near.
In this article, we will analyze Reliance Industries (LTP: 1234.85) and Tata Motors (LTP: 677.75) to understand why these stocks could see upward movement in the coming sessions.
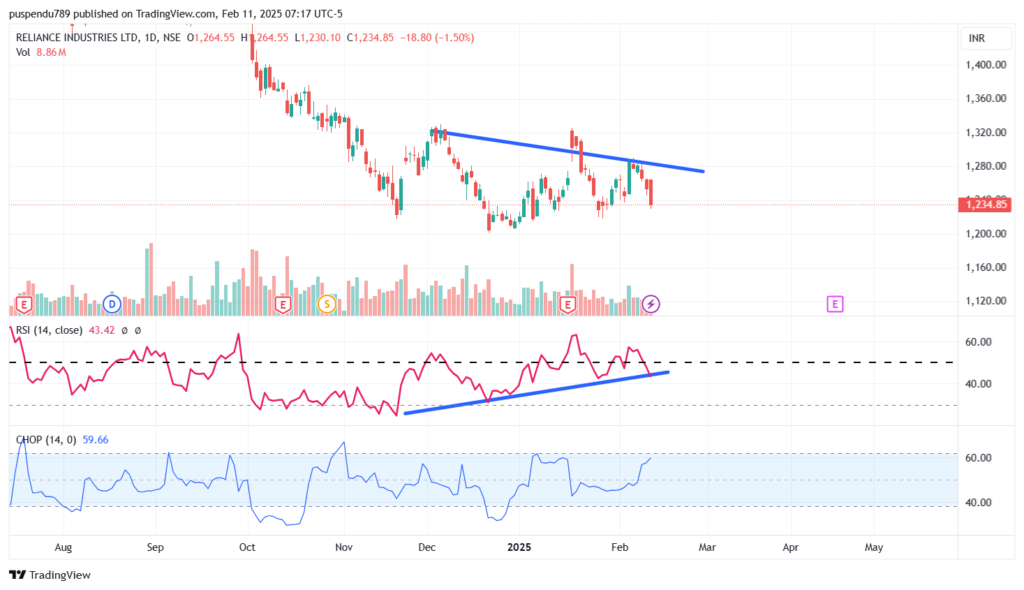
Reliance Industries (NSE: RELIANCE)
Technical Indicators:
- LTP: ₹1234.85
- RSI: Rising steadily (e.g., from 35 to 45 in the past sessions)
- Price Movement: Declining despite increasing RSI
- Support and Resistance Levels:
- Resistance-6: ₹1,570.00
- Resistance-5: ₹1,510.00
- Resistance-4: ₹1,450.00
- Resistance-3: ₹1,390.00
- Resistance-2: ₹1,330.00
- Resistance-1: ₹1,270.00
- Closing Price: ₹1,234.00
- Support-1: ₹1,210.00
- Support-2: ₹1,160.00
- Support-3: ₹1,110.00
- Support-4: ₹1,060.00
- Support-5: ₹1,010.00
- Support-6: ₹960.00
Analysis:
Reliance Industries is showing a classic bullish divergence, where RSI is increasing while price is still trending downward. This suggests that sellers are losing strength and a potential reversal could be on the horizon.
If the stock sustains above the ₹1220 support level, we may witness a bounce towards ₹1260-1275 levels in the near term.
Trading Strategy:
- Buy near ₹1220-1230 with a stop loss at ₹1210.
- Target: ₹1260-1275.
- Confirmation: A breakout above ₹1250 with volume would strengthen the bullish case.
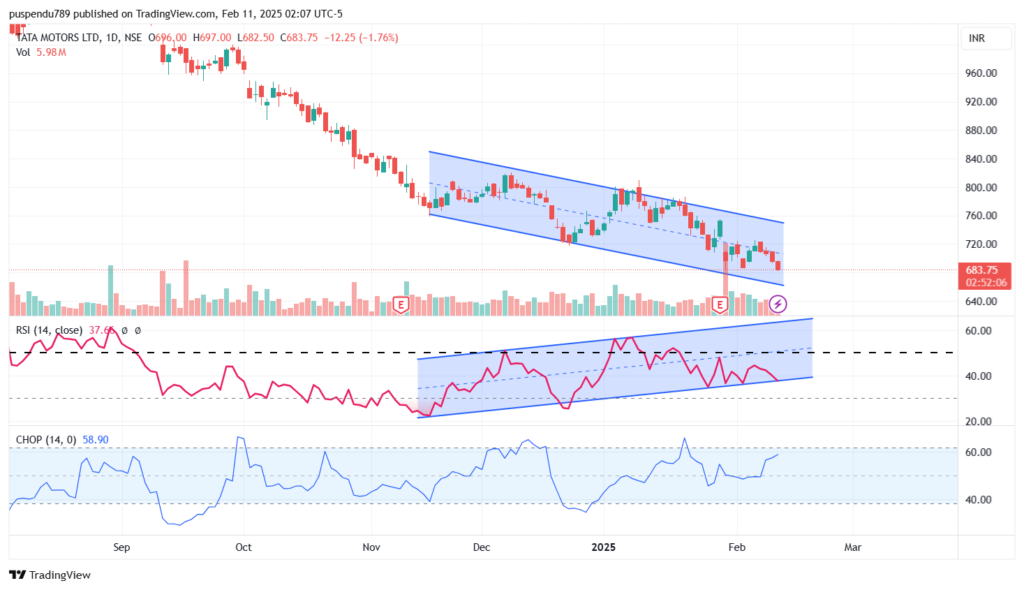
Tata Motors (NSE: TATAMOTORS)
Technical Indicators:
- LTP: ₹677.75
- RSI: Increasing (e.g., from 40 to 50 recently)
- Price Movement: Downward despite RSI going up
- Support and Resistance Levels:
- Resistance-6: ₹910.00
- Resistance-5: ₹860.00
- Resistance-4: ₹810.00
- Resistance-3: ₹770.00
- Resistance-2: ₹730.00
- Resistance-1: ₹690.00
- Closing Price: ₹677.00
- Support-1: ₹650.00
- Support-2: ₹610.00
- Support-3: ₹570.00
- Support-4: ₹530.00
- Support-5: ₹490.00
- Support-6: ₹460.00
Analysis:
Tata Motors is also exhibiting bullish divergence, signaling that sellers are losing control and an upward move could be in sight. The stock has strong support around ₹665-670, and if it holds this level, a rebound towards ₹700-710 is likely.
Trading Strategy:
- Buy near ₹670-680 with a stop loss at ₹665.
- Target: ₹700-710.
- If the stock breaks above ₹690 with good volume, expect further bullish momentum.
Upcoming Gann Dates for Tata Motors
- 12-02-2025
- 21-02-2025
- 02-03-2025
- 12-03-2025
- 22-03-2025
- 01-04-2025
- 11-04-2025
- 21-04-2025
- 01-05-2025
- 11-05-2025
- 21-05-2025
- 01-06-2025
- 12-06-2025
Upcoming Gann Dates for Reliance Industries
- 11-02-2025
- 22-02-2025
- 05-03-2025
- 16-03-2025
- 27-03-2025
- 07-04-2025
- 19-04-2025
- 01-05-2025
- 13-05-2025
- 25-05-2025
- 06-06-2025
- 18-06-2025
- 30-06-2025
Conclusion
Both Reliance Industries and Tata Motors are displaying a bullish divergence pattern, where RSI is rising while prices are falling. This indicates a potential reversal and an opportunity for traders to go long.
Traders should monitor support levels, volume confirmation, and key resistance breakouts before entering trades. If the bullish divergence plays out, we may see upside movement in both stocks in the coming sessions.
Disclaimer
This analysis is for educational purposes only and not financial advice. Traders should conduct their own research and risk management before making investment decisions.