
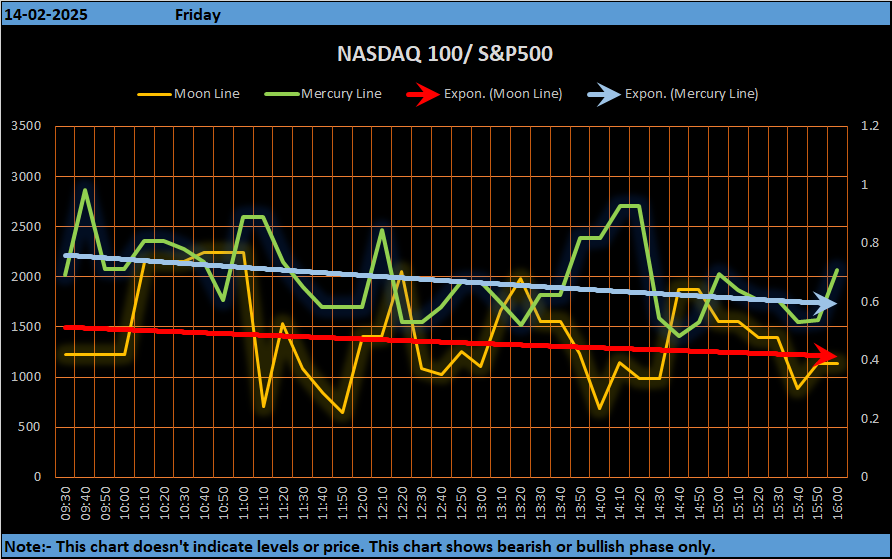
The US stock market is expected to experience a volatile trading week from 10th to 14th February 2025, influenced by a combination of planetary movements, Gann cycles, and technical levels. This analysis, based on Vedic financial astrology and technical indicators, will help traders and investors navigate market trends in the Nasdaq 100, S&P 500, and Dow Jones.
Key Planetary Influences for the Week
- Moon in Cancer (Bearish Start): The market opens under a bearish Moon in Cancer on 10th February 2025, indicating a downward bias.
- Mercury Transiting into Aquarius (Bearish Sentiment): This transit is crucial as Mercury, the planet governing communication and trading, will be aspected by Sun and Uranus, which can lead to unexpected movements.
- Sun Transiting into Aquarius on 12th February: This marks an important Gann Pressure date, likely creating a short-term market top.
- Mars Retrograde Throughout the Week: Retrograde Mars can cause sharp, unexpected movements, bringing high volatility.
- Mercury Combust All Week: A combust Mercury weakens logical market reactions, increasing unpredictability.
Daily Market Sentiment & Financial Astrology Predictions
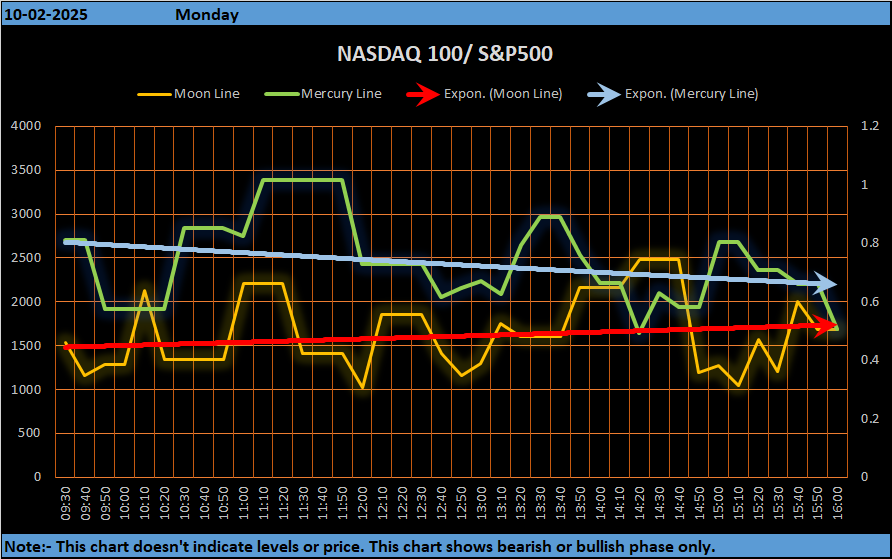
Monday, 10th February 2025
First Half:
- Moon in Cancer (Pushya Pada-1), a bearish sign.
- Saturn, the Nakshatra Lord, is in Aquarius, aspected by Mars in trine (negative for bullish momentum).
- Aspects from Rahu, Ketu, and Neptune create mixed-to-bearish sentiment.
Second Half:
- Moon moves to Pushya Pada-2, still bearish, but gains aspects from Venus and Pluto, signaling a possible recovery.
- Important Time: 1:30 PM – 2:00 PM (Moon changes position at 1:35 PM; expect increased volatility).
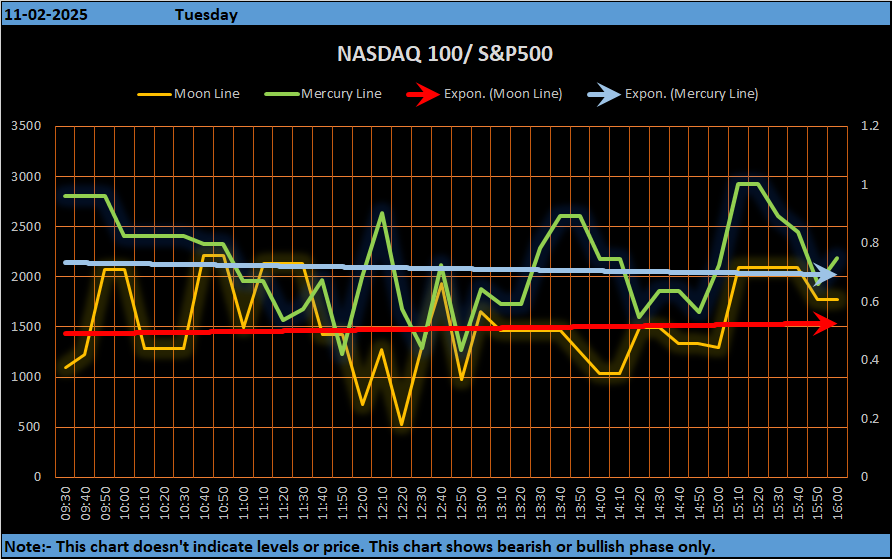
Tuesday, 11th February 2025
First Half:
- Moon in Ashlesha Pada-1 (Mercury’s Nakshatra), a slow bearish trend expected.
- Mercury gets bullish aspects from Sun and Uranus.
- Moon sextile Jupiter supports mild recovery.
Second Half:
- Moon in Ashlesha Pada-2, continuing mixed movements with slow bullish sentiment.
- Dull market behavior all day.
- Important Time: 2:00 PM – 2:30 PM (Mercury & Moon changing positions at 2:15 PM).
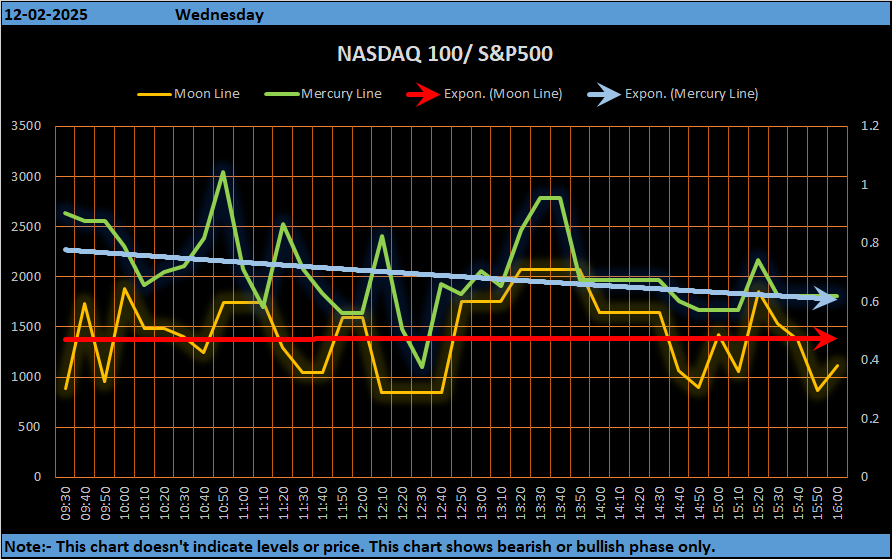
Wednesday, 12th February 2025
First Half:
- Moon moves into Leo (Magha Pada-1), a bullish sign.
- Ketu, the Nakshatra Lord, is aspected by Neptune, adding speculative volatility.
- Sun, Mercury, and Mars aspects give bullish momentum.
Second Half:
- Moon in Magha Pada-2, but weak semi-square aspect with Mercury leads to mixed and volatile movement.
- Important Time: 10:00 AM – 10:30 AM and 3:30 PM – 4:00 PM (Sun & Moon changing signs at 10:35 AM & 3:23 PM).
- Gann Pressure Date: A possible top formation.
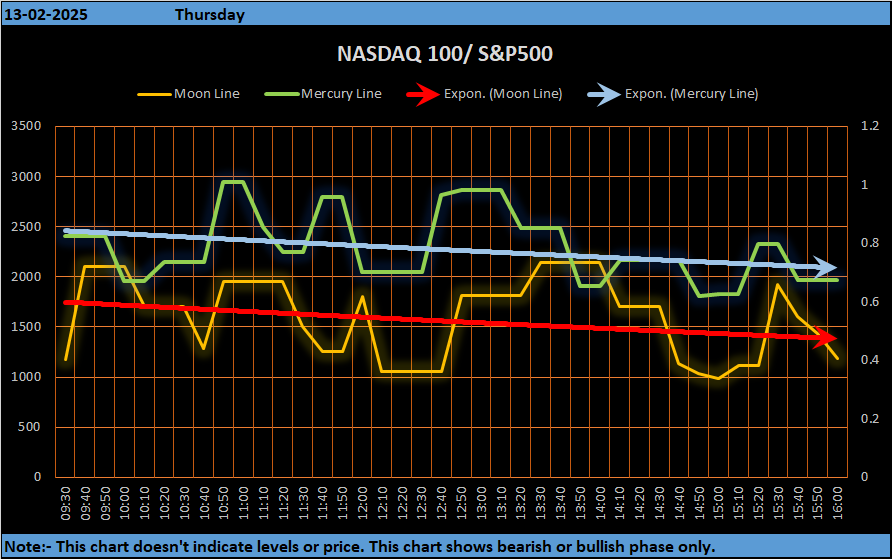
Thursday, 13th February 2025
First Half:
- Moon remains in Leo (Magha Pada-4), with no aspects, leading to a bullish sentiment.
Second Half:
- Moon enters Purva Phalguni Pada-1 (Venus Nakshatra).
- Jupiter aspects the Moon, shifting the market to bearish.
- Important Time: 10:30 AM – 11:00 AM (Moon changes Pada at 10:35 AM).
Friday, 14th February 2025
First Half:
- Moon in Purva Phalguni Pada-4 (Venus Nakshatra).
- Aspects from Saturn and Mars suggest bullish momentum.
Second Half:
- Moon in Uttara Phalguni Pada-1 (Sun Nakshatra).
- Uranus aspect may cause an upward movement.
- Important Time: 12:30 PM – 1:00 PM (Moon changes Pada at 12:37 PM).
Technical Analysis: Key Support & Resistance Levels
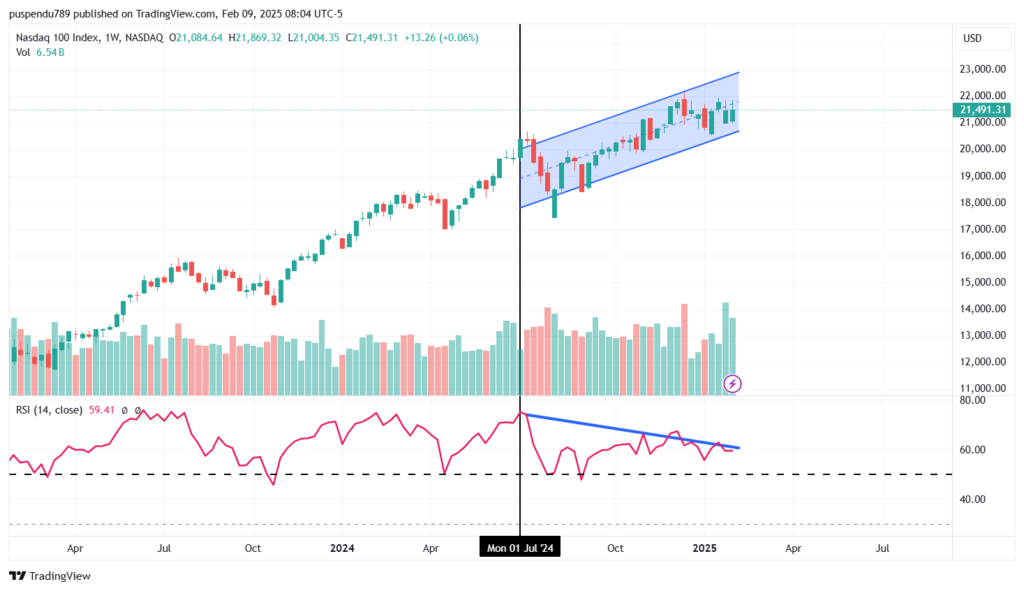
NASDAQ 100 Weekly Levels
- Resistance Levels: $21,800, $22,500, $23,300, $24,100, $24,900, $25,700
- Support Levels: $21,100, $20,400, $19,700, $19,000, $18,300, $17,600
- Last Closing Price: $21,491
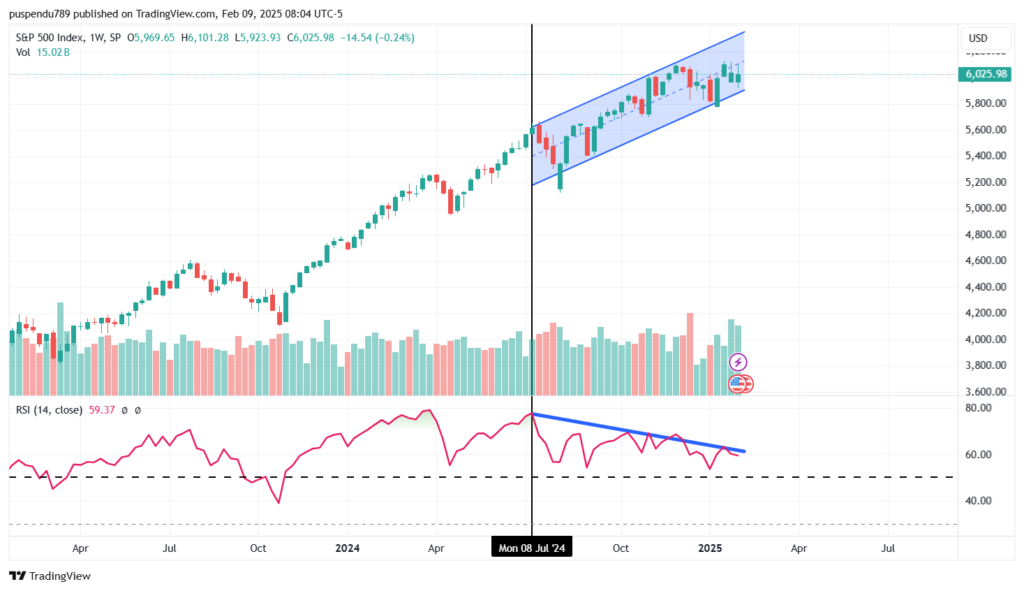
S&P 500 Weekly Levels
- Resistance Levels: $6,130, $6,250, $6,380, $6,510, $6,640, $6,770
- Support Levels: $6,010, $5,890, $5,770, $5,650, $5,530, $5,410
- Last Closing Price: $6,026
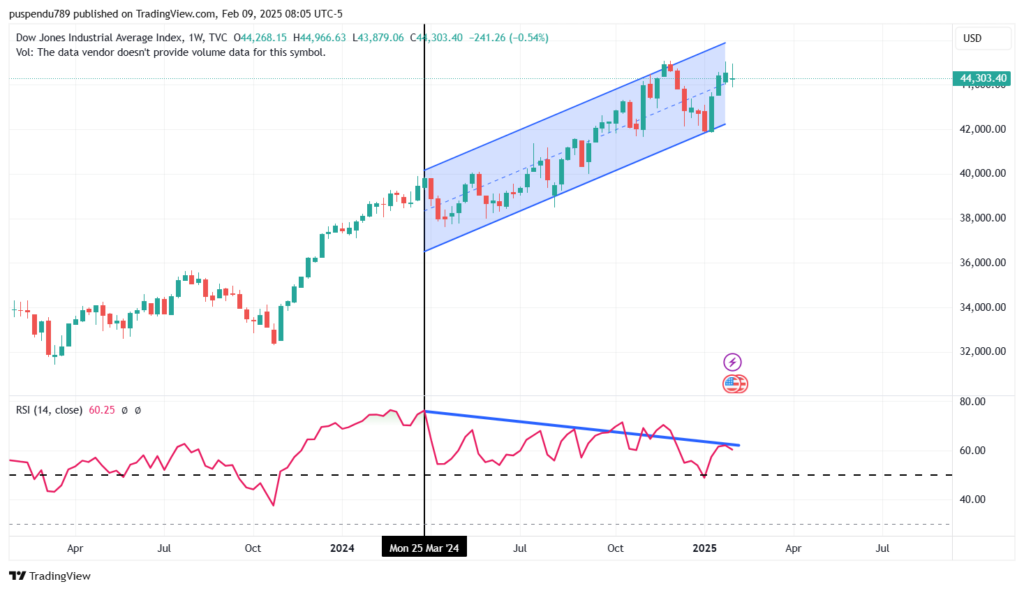
DOW JONES Weekly Levels
- Resistance Levels: $45,200, $46,300, $47,400, $48,500, $49,600, $50,700
- Support Levels: $44,100, $43,100, $42,100, $41,100, $40,100, $39,100
- Last Closing Price: $44,303
Trading Strategies for the Week
- Long Trades:
- Enter around strong support levels (NASDAQ: $21,100, S&P 500: $6,010, Dow: $44,100).
- Bullish Days: 12th & 14th February (Leo Moon, Venus & Sun influences).
- Short Trades:
- Enter around major resistance zones (NASDAQ: $24,100+, S&P 500: $6,510+, Dow: $48,500+).
- Bearish Days: 10th & 11th February (Cancer Moon, Mercury’s transit to Aquarius).
- High Volatility Timings:
- Monday (1:30 PM – 2:00 PM), Tuesday (2:00 PM – 2:30 PM), Wednesday (10:00 AM – 10:30 AM, 3:30 PM – 4:00 PM), Thursday (10:30 AM – 11:00 AM), Friday (12:30 PM – 1:00 PM).
Technical Analysis of Weekly Candle Charts
Analyzing the weekly candle charts of NASDAQ 100, S&P 500, and DOW JONES, a critical pattern emerges: RSI is trending downward while prices continue to rise. This phenomenon is known as bearish divergence, a classic signal of an impending market correction. Traders should exercise caution, as this divergence suggests the market may soon experience a pullback.
Conclusion
This week’s US stock market forecast suggests a mix of bullish and bearish phases, with significant volatility driven by planetary movements and technical indicators. The bearish divergence in RSI is a major red flag for traders, indicating a potential correction in the coming weeks. Stay updated with Stocklord.in for precise daily market insights and trading strategies.
📌 For more financial astrology-based stock market predictions, visit Stocklord.in.